Page History
Table of Contents
| Table of Contents |
|---|
The TESS mission has several data products ranging from the TESS input catalog to a catalog of planet candidates. Here we give an overview of what information is in each data product. For more information on how to download products at MAST is covered in Section 5.
Photometric Data Products
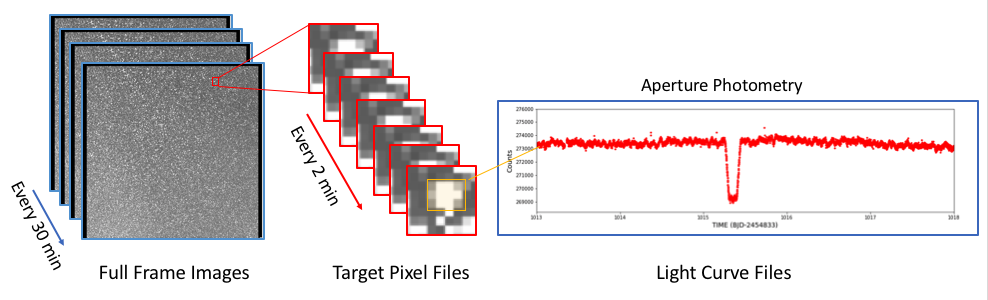
TESS obtains time-series photometry at a few different cadences with a baseline ranging from ~27 days to a full year, depending on sector overlap. An overview of the primary pixel-level science products are shown above. The entirety of the CCDs are known as the known as the Full Frame Images (FFIs). Certain groups of pixels are also downloaded at a shorter cadence in order to obtain a faster cadence for a subset of targets, these are known as Target Pixel (TP) files. The pixels around a selected star are stored as arrays in these target-pixel files, one image per time stamp. Aperture photometry is performed on each image creating an array of fluxes; these are known as Light Curve (LC) files. See the Science Product Handbook for more detailed information on file formats and content. See the Levels Of Data Processing page to better understand how SAP, PDCSAP, and Co-trending Basis Vectors relate to TESS data products.
- Full Frame Images (FFI) (uncalibrated: _ffir.fits, calibrated: _ffic.fits): These files contain the 30-minute, or 10-minute, or 200-second cadence time series of the entire field of view, both an un-calibrated and calibrated version are available.
- For users who plan to use most or all of the FFIs, the FFI data files are best obtained using the bulk download scripts.
- TESScut service. TESScut cutouts of the calibrated FFI time series (ffic files) are available through the MAST TESScut service. This creates files that look like the target pixel files, but are at the cadence of the FFIs and do not include background subtraction. Also note that the times in the TESScut files have not been barycenter corrected beyond the correction applied by the mission, which is corrected to the center of the CCD. For more information on the TESScut files, see the astrocut documentation. The FFI cubes from which TESScut performs its cutouts are available in the public S3 bucket on AWS.
- Target Pixel (TP) Files (_tp.fits, _fast-tp.fits): These files contain a time series of the raw and calibrated pixels downloaded at the 2-minute and 20-second cadence.
- Light Curve (LC) Files (_lc.fits, _fast-lc.fits): These files contain the flux time series derived from the calibrated 2-minute and 20-second target pixels. These files contain several time series including the simple aperture photometry, a detrended light curve, position vectors, and quality flags. The aperture photometry flux series is known as the SAP_FLUX, while the flux series that has the common instrumental systematics removed using the CBV files is known as the PDCSAP_FLUX. The PDCSAP_FLUX light curves also correct for the amount of flux captured by the photometric aperture and crowding from known nearby stars.
Cotrending Basis Vectors (CBV) (_cbv.fits): The cotending basis vectors represent the set of systematic trends present in the ensemble light curve data for each CCD and can be used to remove common instrumental systematics from the data. These vectors are created by the pipeline to produce the detrended flux time series (PDCSAP_FLUX) in the light curve files. The CBVs can be fit to individual aperture photometry light curves (known as SAP_FLUX) on the same channel in order to fine tune the detrending. (There are no CBVs associated with the fast, 20-second light curves.)
Extended Mission Update
Sector 27 is the first set of data associated with the TESS extended mission that began in July 2020. There are a few changes to the observing mode associated with the extended mission. The FFIs are now readout at a 10-mintue cadence instead of a 30-minute cadence. Also a select set of targets are being read-out at a 20-second cadence, in addition to the 2-minute cadence. These short cadence observations are delivered as target pixel and light curve files. No Data Validation files are created for the 20-second data products.
Second Extended Mission Update
Sector 55 56 is the first set of data associated with the second TESS extended mission that began in September 2022. The FFIs are now readout at a 200-second cadence instead of a 10-minute cadence.
| Divbox | |||||||||||||||||||||||||||||||||||||||||||||||||||||||||||||||||||||||||||
|---|---|---|---|---|---|---|---|---|---|---|---|---|---|---|---|---|---|---|---|---|---|---|---|---|---|---|---|---|---|---|---|---|---|---|---|---|---|---|---|---|---|---|---|---|---|---|---|---|---|---|---|---|---|---|---|---|---|---|---|---|---|---|---|---|---|---|---|---|---|---|---|---|---|---|---|
| |||||||||||||||||||||||||||||||||||||||||||||||||||||||||||||||||||||||||||
Table: Cadence Quality FlagsThe TESS pipeline populates a series of quality flags to indicate when a cadence may have been taken during an anomalous event. These flags are available in the light curve files, the target pixel files, and a subset are available for the FFIs. Those in the FFIs are created by taking a logical AND across the short cadences. The following table describes the meaning of each flag.
|
| Divbox | |||||||||||||||||||||||||||||||||||||
|---|---|---|---|---|---|---|---|---|---|---|---|---|---|---|---|---|---|---|---|---|---|---|---|---|---|---|---|---|---|---|---|---|---|---|---|---|---|
| |||||||||||||||||||||||||||||||||||||
Table: Aperture Mask Image FlagsThe light curve files and target pixel files contain an image in the APERTURE FITS extension that describes how each pixel was used in the processing. The integer values of this image are the bit-wise OR of the bits described in the following table.
|
Target Catalogs
| Gliffy Diagram | ||||
|---|---|---|---|---|
|
TESS provides several catalogs of target stars in order to choose which stars will be observed at the 2-minute cadence.
- TESS Input Catalog (TIC): Catalog of luminous sources in the sky created by the TESS Stellar Properties Working Group, used to select targets to observe at short cadence. It is also used to estimate flux contributions of stars within pixels. The TIC is available through the MAST Portal, CasJobs, via the API/astroquery, and as a direct download split into a series of .csv files.
- Catalog Target Lists (?CTL): Several lists of TIC stars that idicate the priorities for short-cadence observations from different science perspectives. The same TIC ID may appear in more than one list. See the figure above for the names of the various CTLs. Some CTLs, such as the xCTL, are available for download and searching at MAST.
- Merged Target List (MTL): This list represents the final set of targets that are observed at the 2-minute cadence. It is created by selecting targets in the various CTLs plus specific engineering targets. Each target in the MTL should have a target pixel file and light curve file created from the mission pipeline. This is the product called "target list" on the All Data Products page.
Planet Search Products
The flux time series for each star observed in short cadence are then further detrended and searched for transits. The repeating signals that are identified in this way are known as Threshold Crossing Events (TCE). The following products are produced by the TESS Science Processing Pipeline for each target star that produces a TCE.
The TESS mission searches each sector individually for planets, but also does multi-sector searches for targets that are observed in more than one sector. The DV products listed below exist for these multi-sector searches and can be found in their own Observation when searching for data in the MAST portal or using astroquery. The single sector DV products can be found next to the 2-minute light curves after removing the check mark for minimum recommended products. The DV reports and summaries are also available in bulk from the bulk downloads page.
- DV Time Series File (.dvt.fits): These files contain the sector-stitched, detrended and whitened light curves searched by the TESS Pipeline. All TCEs found on a star in one search are contained in the same file.
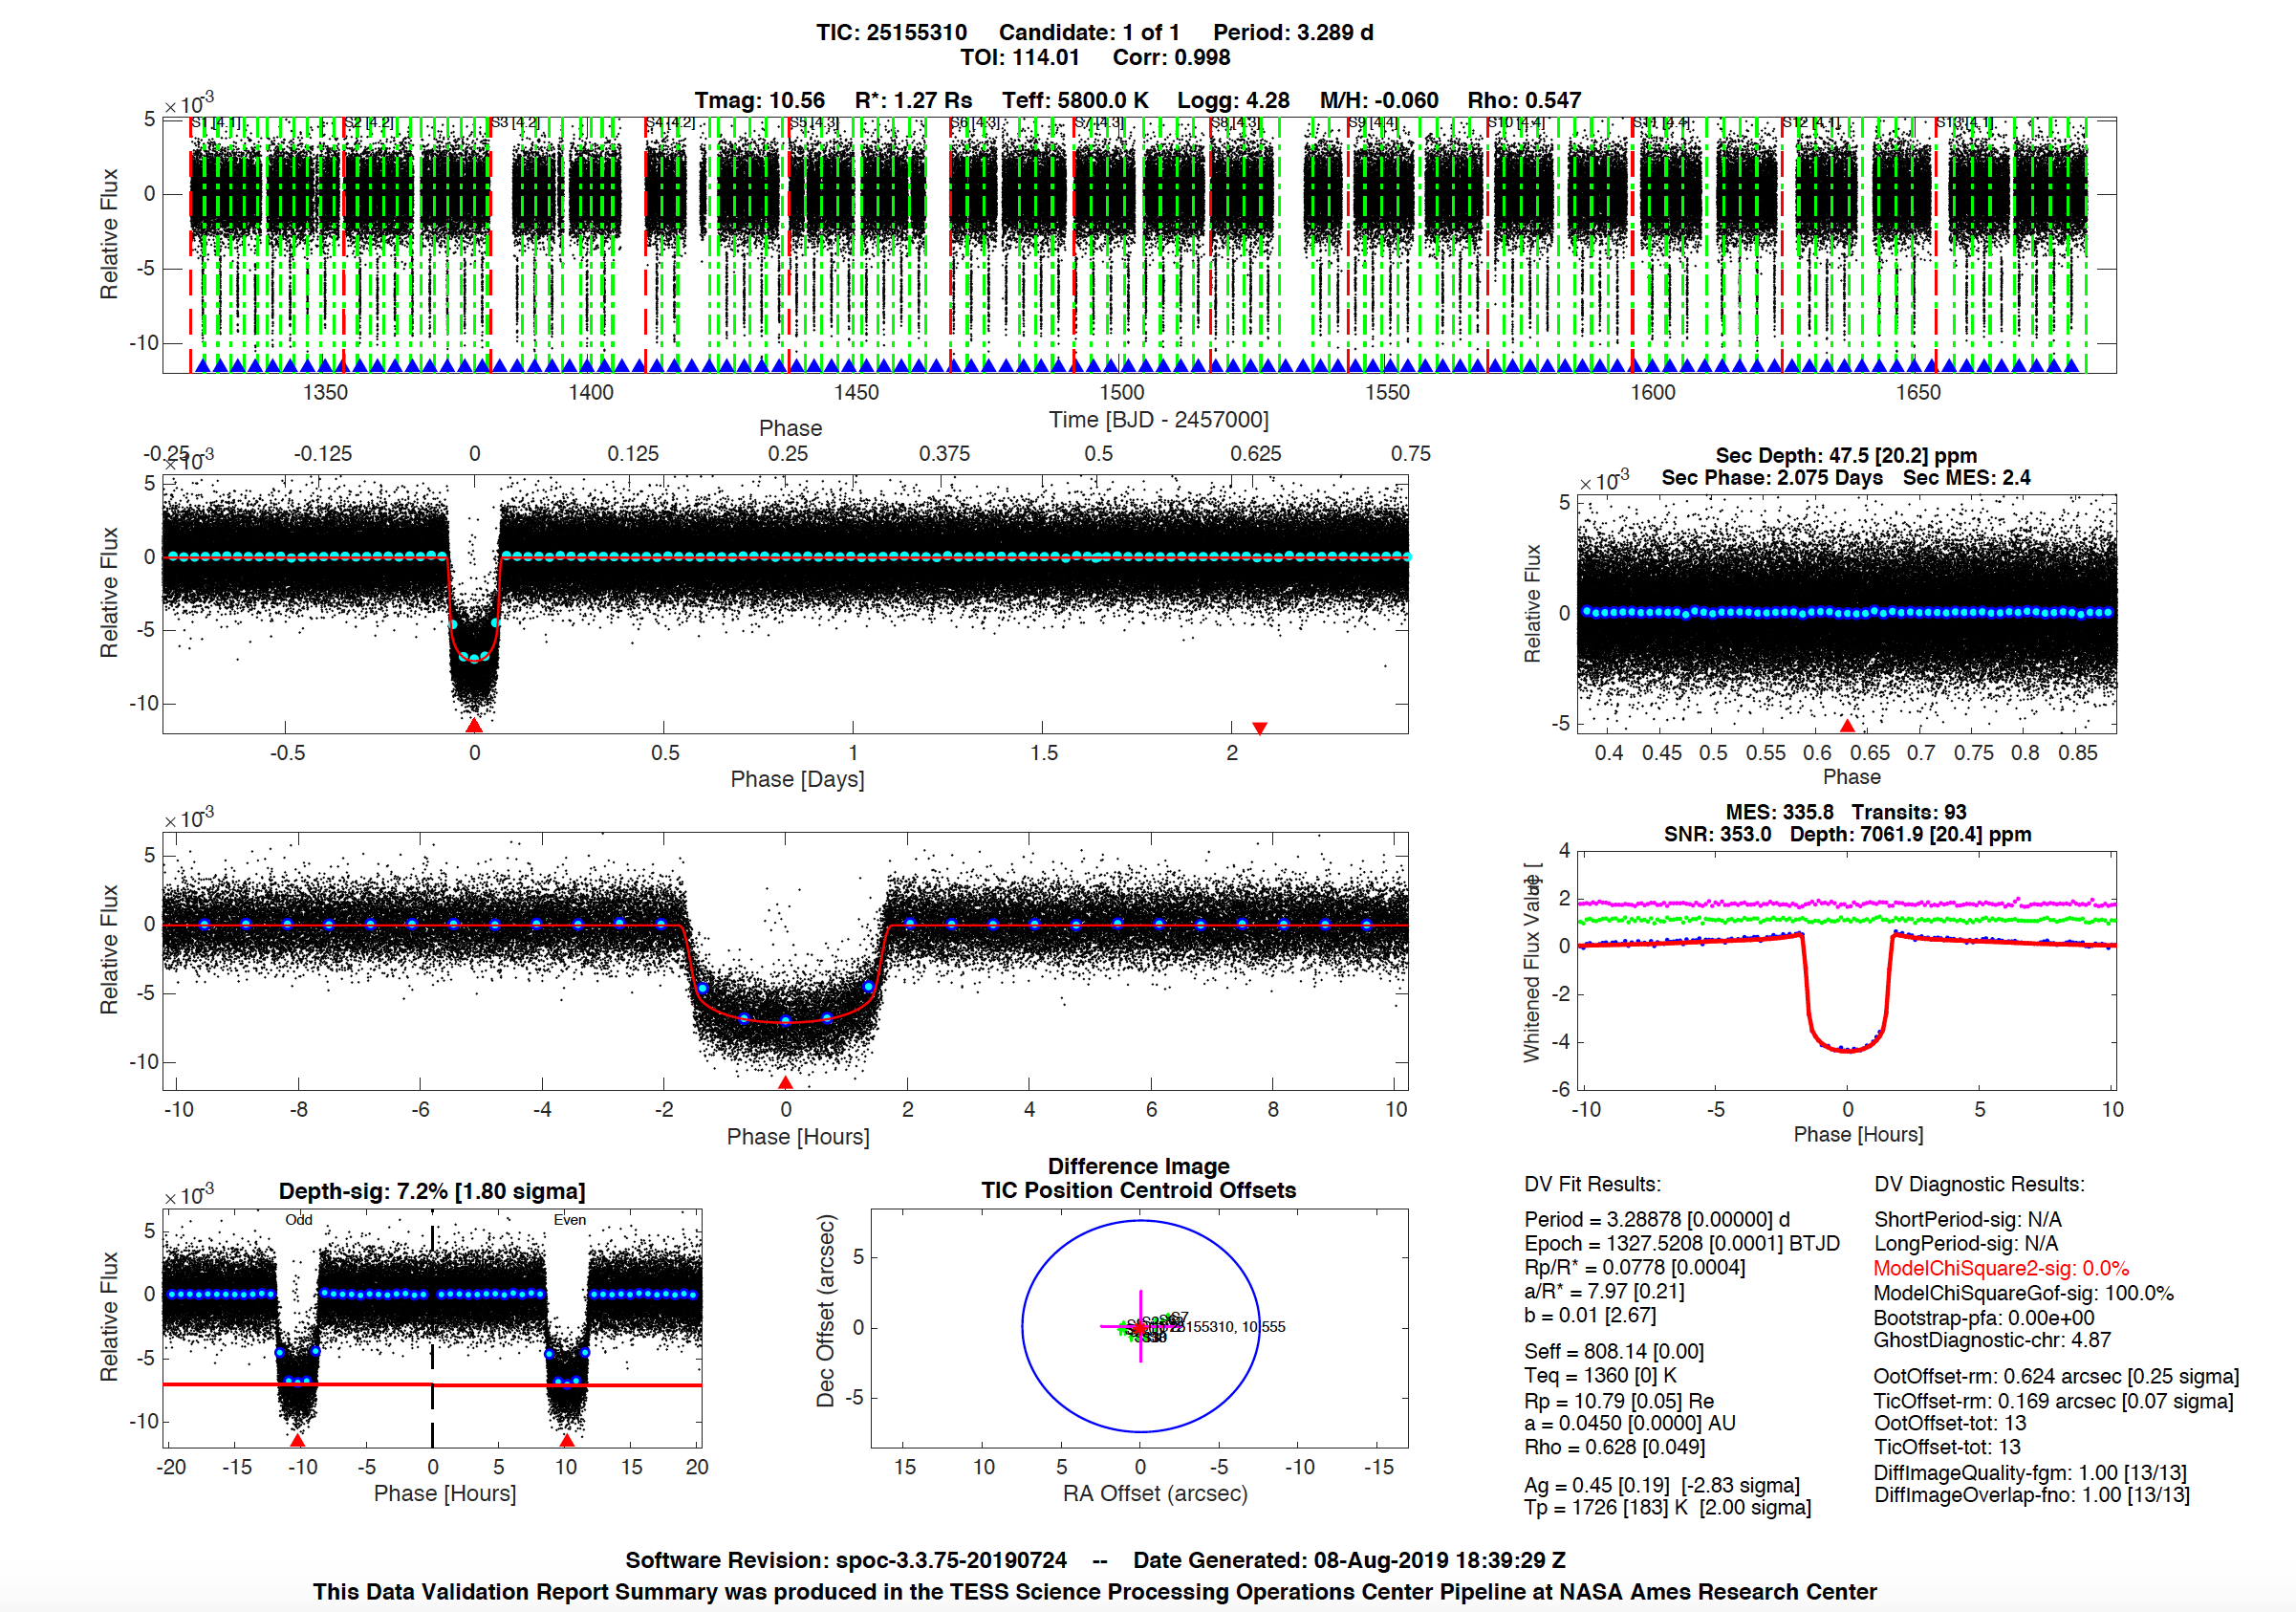
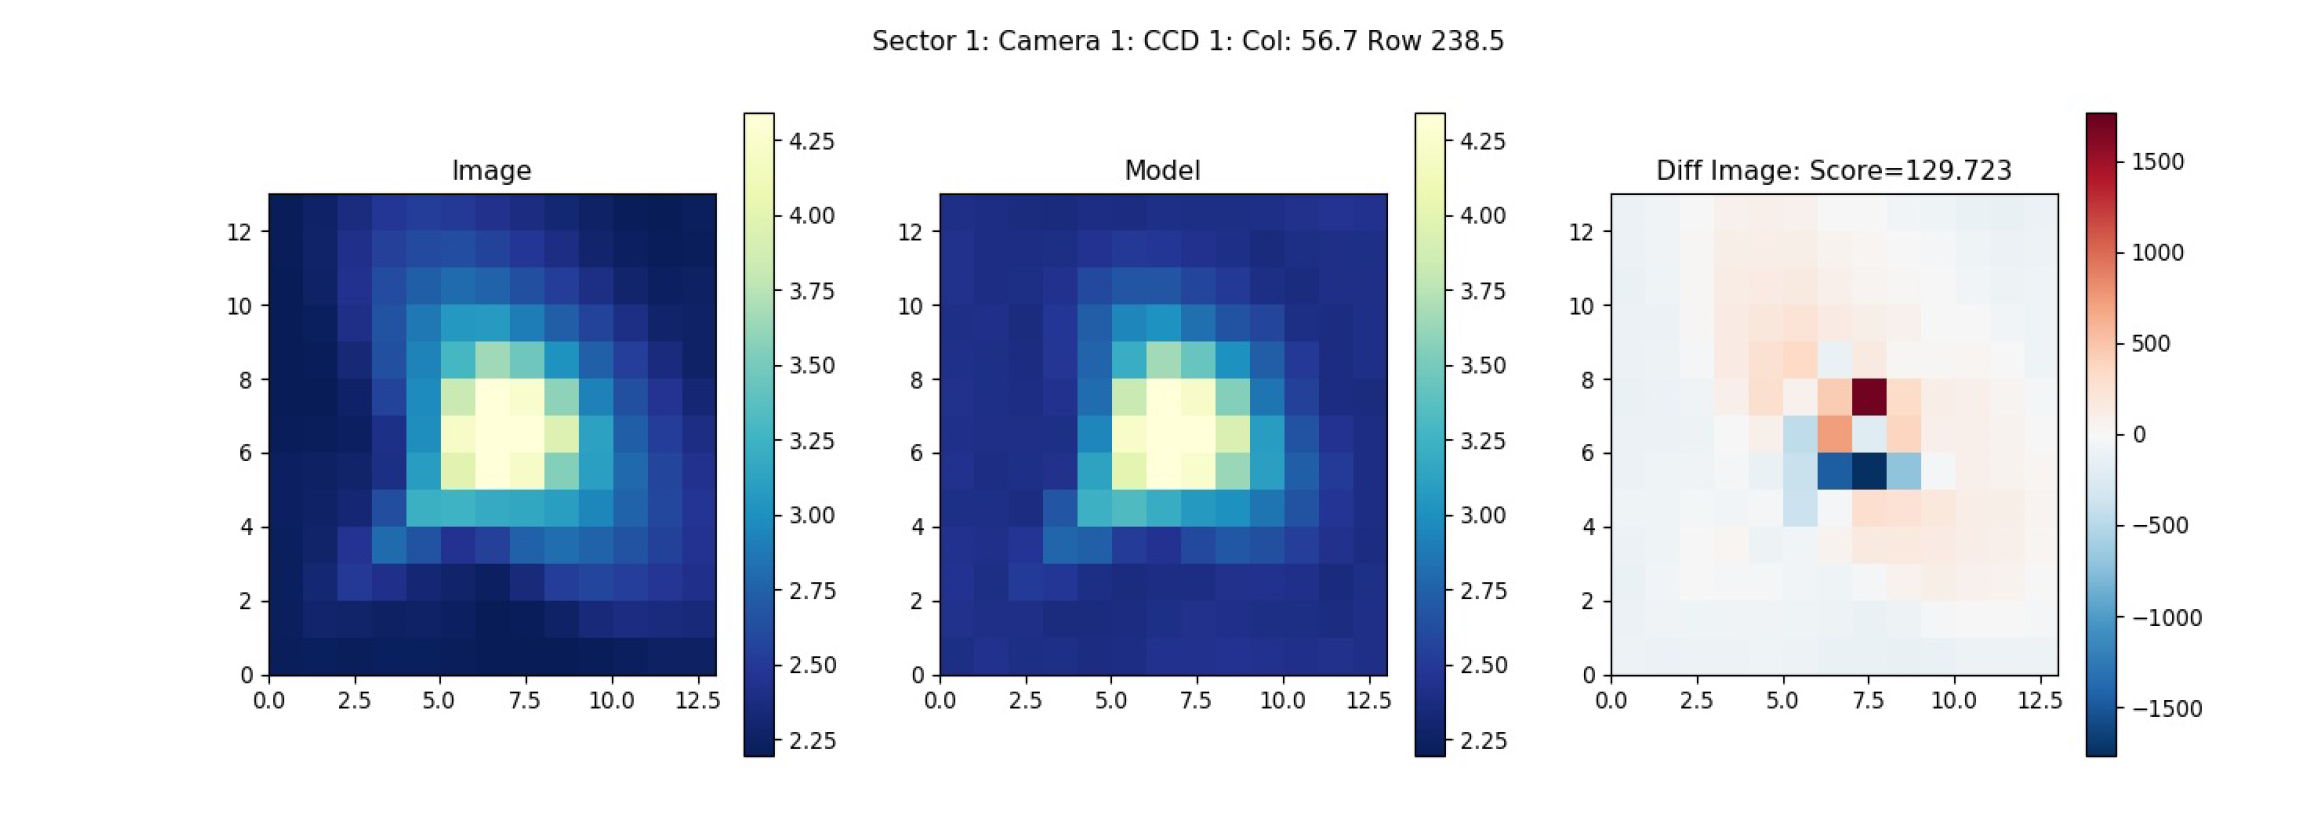
- DV Report (.dvr.pdf): These pdf files contain plots and statistics for every TCE assigned to a given TIC target. For example, the reports contain plots of folded light curves and in- and out-of transit difference images.
- DV One-Page Summary (.dvs.pdf): This one page summary contains a quick overview of each individual TCE and much of the most important information about the TCE to determine if the signal is likely caused by a transit or shows evidence of being caused by an eclipsing binary or instrumental noise. Each TCE gets its own file, so if multiple TCEs are found on the same TIC target, there will be multiple _dvs.pdf files for that target. These files are very similar to those produced for Kepler and a description of some of the metrics on this page can be found here.
- DV mini report (.dvm.pdf): This is a multi-page report that contains vetting metrics to evaluate whether a TCE is a planet, but is not as detailed as the full DV report. There is one mini-report per search per star.
Exoplanet Result Catalogs
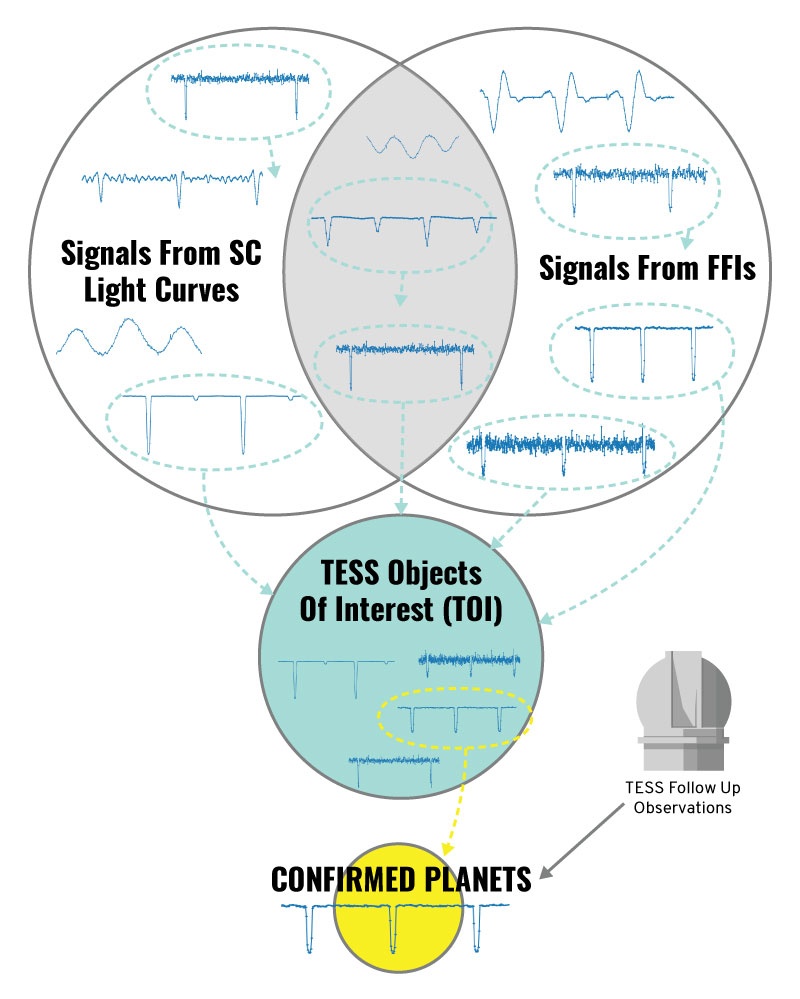
TESS produces several catalogs of possibly transit-like, periodic signals found in the TESS data. As signals are vetted they are can be included in the next catalog down. The catalog of signals with the least amount of vetting are the Threshold Crossing Events (TCEs) which are produced by the SPOC Pipeline. Other groups may also search the short cadence light curves, or the longer cadence FFIs for signals that may be consistent with transiting exoplanets. Since these signals have little-to-no vetting, the reliability can be quite low. Signals found in the data are then turned into TESS Objects of Interest (TOI) once the signal is vetted and determined to be sufficiently consistent with a transit or eclipse. The TOI list contains both planet candidates and false positives, but these are the signals that are worthy of follow-up observations. Once follow-up measurements, or additional analysis, reveal the mass of the transiting object, or remove all doubt that the signal could be caused by an eclipsing binary, the planet is considered confirmed.
- Threshold Crossing Events (TCE): Table of TCE signals and various metrics that measure different aspects of that signal. For each TCE, the project provides a highly detrended light curve file and a report showing relevant plots to evaluate whether the signal is a planet. The project also provides an xml file for each star that contain all the information related to the TCEs found in that star's light curve. These signals are not vetted and include various types of false positives and instrumental false alarms. Each TCE is identified by a TIC ID, planet number and search ID.
- TESS Objects of Interest (TOI): Table containing the list of signals that are consistent being a transiting planet. This catalog provides a disposition of either planet candidate or false positive which can change as more information is gathered about a target from follow-up and additional analysis of the data.
- Confirmed Planets: Transiting planets found in the TESS data for which follow-up data provide a mass of the planet. See the exoFOP-TESS page for more information about what follow-up data are available.
Engineering and Model Files
These files include the Pixel Response Function, the flat field models, the 2D black model, and the engineering mnemonics. See the full listing of the data products.
Pixel Response Functions
The PRF models were created by the SPOC by fitting to micro-dithered data taken during PRF commissioning exercises. See the Instrument Handbook for details on the data collection. The pixel response functions in FITS or Matlab format and are available from the models/prf_fitsfiles directory. There are two versions of the PRF. Those in the directory start_s0001/ apply to the data taken in Sectors 1–3, and those in start_s0004/ apply to the data taken in Sector 4 and beyond.
For each CCD the pixel response function is provided for 5x5 locations across the detector. For each CCD location, there is an associated FITS file. The reference row/column of the grid points are provided in the image file names and FITS headers. These reference locations define the center of the PRF image in the TESS CCD coordinate system. The images are composed of 9x9 intra-pixel samples per physical TESS CCD pixels. The size of the PRF provided for each intra-pixel sample is 13x13 pixels.Each FITS file contains two extensions---the primary header contains the PRF image data itself, and the 2nd extension contains the uncertainties. Users can interpolate between both the location on the CCD and the intra-pixel location to obtain a PRF for an arbitrary location on the detector.
The 'PHYSICAL' WCS solutions can be used to convert the PRF image coordinates to the corresponding locations on the TESS CCDs. The TESS CCD coordinate systems are defined so that row,col = 1,1 is the center of the lower left pixel of each CCD. Note that the PRF locations do not always map to "real" TESS pixels---in the adopted coordinate system, there may be negative TESS pixels, or pixels larger than the total number in the CCD imaging arrays (> 2048). These locations are well defined in the instrument's focal plane even though no light-sensitive pixels are present. Bilinear interpolation on the images between the grid points can be used to estimate the PRF at arbitrary locations and is accurate to 1%--5%. This coordinate system is offset from the FFIs/TPF coordinate system by 44 columns, owing to the presence of collateral pixels in the science data products (overscan regions).
...