Page History
| Excerpt |
|---|
Users of the current PS1 DR1 data should be aware of a few issues and inconsistencies in the data.
|
| Tip | ||||||
|---|---|---|---|---|---|---|
| ||||||
|
Missing data
The current version of the database (released 2017 March 17) is thought to be complete over the sky, with no significant remaining gaps. There are a small number of objects (about 184,000, or 0.006%) that are missing in the StackObjectThin table. Currently we do not expect these stack objects to be filled in before the DR2 data release. For most purposes, this version of the catalog can be treated as complete.
In the 2017 February 2 release, a small number (about 0.01%) of objects were missing from the MeanObject table. The missing objects were near declination = +30 degrees. A new CasJobs table named MeanObjectMissing_03172017 gives information on the 14 million objects that were added to the catalog in the most recent update. It should be possible to run most queries again using this much smaller table to quickly fill in missing data. Note that only a small part of the sky is affected, so changes should be limited for most projects.
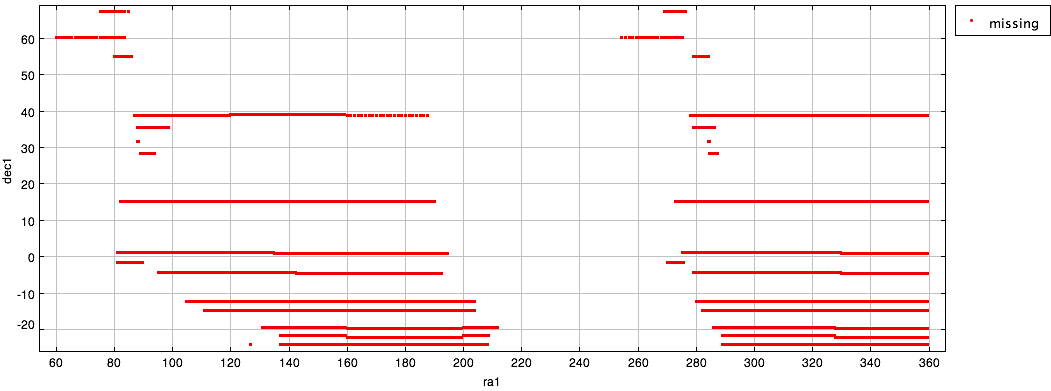
The original 2016 December 19 release of database was missing much more data over about 1.5% of the sky. The missing regions fell at the boundaries between the declination strips that are used to organize the underlying databases. The figure below shows a schematic representation of the locations where data are missing. A database update on 2017 February 2 filled in almost all of the missing objects.
For users who have done large-scale queries and want to get just the new objects, there are 3 new tables to make this easier. ObjectThinMissing has 132 million objects that were previously missing from ObjectThin; MeanObjectMissing has the same 132 million objects that were missing from MeanObject; and StackObjectThinMissing has 40 million objects that were missing from StackObjectThin. It should be possible to run most queries again using these much smaller tables to quickly fill in missing data.
Astrometry differences between stack and mean positions
The astrometry for the mean object positions in PS1 (the raMean and decMean columns in the ObjectThin table) were updated shortly before the PS1 DR1 release using Gaia as a reference catalog. The previous version of the astrometry used 2MASS as a reference catalog. That version had systematic absolute errors of up to ~0.1 arcsec depending on the location in the sky. The new Gaia-based astrometry is much more accurate, with median errors of only about 5 milliarcsec. See the PS1 Astrometry page for more details.
However, the astrometry in this update was only applied to objects that are detected in the single-epoch warp images. Objects too faint to be detected in single epoch images are detected only in the deeper stack images. The RA and Dec measurements for stack objects have not been placed on the Gaia frame and so have larger systematic errors than mean measurements.
Stack-only objects are within ~1.3 mag of the 5σ detection limit of the survey and so tend to have noisier position measurements. That means that the position for an object is not greatly degraded by the systematic error. But if the positions of multiple faint stack objects are averaged (e.g., by using a set of stack objects as an astrometric reference), the systematic errors in the astrometry may become noticeable.
The bottom line is that users should take care with the astrometry of objects that are not detected in the mean filter magnitudes. We expect this to be fixed in the DR2 release.
Astrometric and photometric differences between images and catalogs
The astrometric world coordinate system keywords in the FITS image headers were derived at the time the image pixels were processed. The catalogs have had significant post-image processing to improve both the astrometric and photometric calibrations of the catalog objects. The Gaia DR1 catalog, which was released well after the pixel processing was complete, was used to improve the astrometric calibration of the catalog object positions. The ubercal procedure was used to modify the photometric calibration using sources observed in multiple images. That allowed correcting small errors in the photometry that depended on the exposure conditions, the epoch of the observation, the position in the detector, etc.
Since both of these calibrations were completed after the creation of the images, the image FITS headers do not reflect the improvements. Measurements made directly from the images will consequently not be as accurate either photometrically or astrometrically as measurements in the catalog.
We may at some future point update the astrometry in the images to correct for larger shifts between the Gaia-based coordinates and the older 2MASS-based coordinates. Accurate corrections of the smaller scale astrometric and photometric variations from the catalog-phase processing would require reprocessing the images. That is not being contemplated at this time.
Astrometry issues near the pole
Some exposures near the pole suffer from incorrect astrometry, with errors up to 1". As a result the stacking process has been affected, resulting, in the worse cases, in double images. The WCS content of the FITS headers in both warp and stack images may therefore be incorrect. Most of the problems lie above a Declination of +85 degrees.
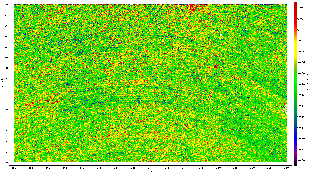
The warp catalogue positions (and therefore ramean and decmean) are not affected, as these have been re-calibrated to Gaia (except possibly for the slice indicated in the figure below), However, the stack catalogue positions (rastack, decstack, and the individual stack positions for each band) may be in error, and may differ between bands.
| This image indicates the extent of the problem. It shows the median difference between decmean and decstack values in DR1 above 80 deg Declination (for objects with 16<ipsf<20). The colour range spans offsets of +/-0.25". Areas coloured blue or red should be treated with caution. The general mottling effect at the +/-0.1" level is due to the Gaia recalibration of the warp (but not stack) catalogue positions. The smooth, wedge-shaped section between 7h and 15h is believed to be a region where the Gaia recalibration of the warps did not make its way into DR1. It extends down to +75 deg. This will be corrected in DR2. |
|---|
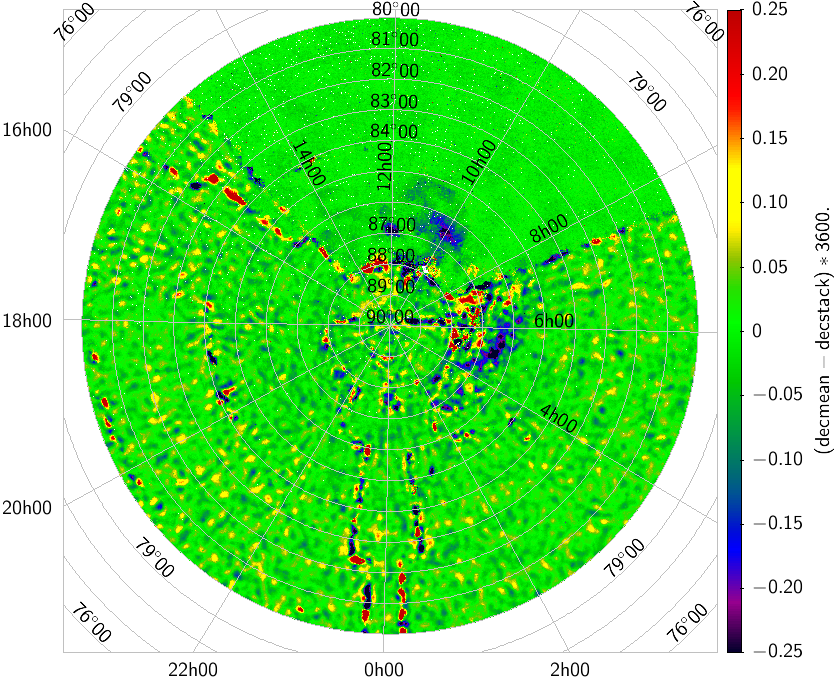
Our intention is to produce corrected images and new, separate, polar region catalogues for DR2.
FITS image format quirks
The FITS images have several unusual characteristics. They are described in more detail in the image cutout documentation. We may fix this at some time in the future, but since we have 2 petabytes of PS1 FITS images, this is unlikely to be done soon.
The images are compressed using the FITS tile-compressed image convention. The format can be read by most FITS libraries or can be converted back to a standard uncompressed FITS image using the fpack utility. Note that this applies only to the full skycell FITS images – FITS cutout images are not compressed.
One quirk of these images is that they use the obsolete WCS keywords PC001001, PC001002, PC002001, PC002002 instead of the FITS standard keywords CD1_1, CD1_2, etc. Many software packages automatically handle the old PC keywords, but some require special processing (e.g., in IDL you should call the fits_cd_fix procedure to modify the header). If you do not use these keywords, you will find that the RA pixel spacing has the wrong sign (it is positive instead of negative).
The image pixel values have been non-linearly scaled using an arc hyperbolic sine (asinh) transformation that converts them to a pseudo-magnitude scale related to the asinh magnitudes (aka "luptitudes") that are used in the Sloan Digital Sky Survey. The scaling is determined by the BSOFTEN/BOFFSET keywords in the FITS header. Here are the relevant lines from the header of the skycell 1725.051 g-band image:
BZERO   =   3.283630371094E+00 / Scaling: TRUE = BZERO + BSCALE * DISK
BSCALE  =   2.008622776974E-04 / Scaling: TRUE = BZERO + BSCALE * DISK
BSOFTEN =   8.739592975627E+01 / Scaling: LINEAR = 2 * BSOFTEN * sinh(TRUE/a)
BOFFSET =   2.654963016510E+00 / Scaling: UNCOMP = BOFFSET + LINEAR
The BZERO and BSCALE keywords are the standard FITS keywords for converting an integer image to a floating point value. If v is the original float pixel value (after applying BZERO/BSCALE to the integer value), these equations convert v to a standard linear flux:
x = v * 0.4 * ln(10) = v / 1.0857362
flux = boffset + bsoften * 2 * sinh(x)
     = boffset + bsoften * (exp(x) - exp(-x))
     = boffset + bsoften * (10**(0.4*v) - 10**(-0.4*v))
The 3 equations for the flux are equivalent. The third equation shows the connection of the values to asinh magnitudes.
The asinh flux scaling also applies only to the full skycell FITS images – FITS cutout images are converted to standard linear fluxes.
Skycell zero-point errors on stack non-psf catalogue data
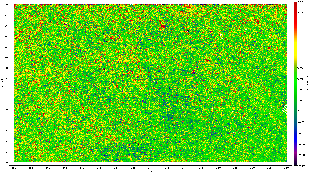
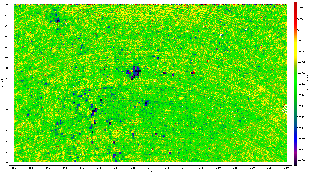
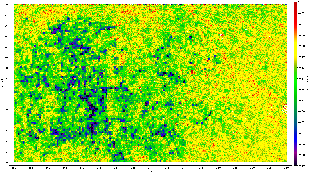
As part of the ubercal process, the stack data are calibrated so that the stack psf mags agree with the mean psf mags from the single exposures. This ensures the stack psf mags are extremely well calibrated. Unfortunately, on some skycells the psf profile fitting process misbehaves and the psf fluxes are not correctly measured. This ubercal process then forces them to be correct, but at the expense of mis-calibrating all the other magnitudes which depend on integrating pixel fluxes (kron, apmag etc) on that skycell. This seems to affect the i-band most. The plots below show the offsets from stack kronmags to SDSS model mags for stars. The colour scale spans 0.25 mags purple to red in all cases and the area is 150<RA<230, 30<Dec<60.
| g (SDSS-gkronmag) | r (SDSS-rkronmag) | i (SDSS-ikronmag) |
|---|---|---|
|
|
|
| z (SDSS-zkronmag) | y (SDSS z - ykronmag) |
|---|---|
|
|
For DR1, a quick fix is to remove the ubercal by setting the zero-points back to the canonical 25.0 to which all stack pixels are initially calibrated. The ubercal zero-points are found in the stackobjectattributes table. So e.g.
ikronmag_corrected = ikronmag-(izp-25)
iapmag_corrected = iapmag-(izp-25)
Remember this does NOT affect the stack psfmags nor any of the magnitudes in the MeanObject table or the ForcedMeanObject table. It will affect the stack fixed aperture fluxes in StackApFlx etc.
The magnitudes should be corrected in DR2, although the underlying issue will still remain.
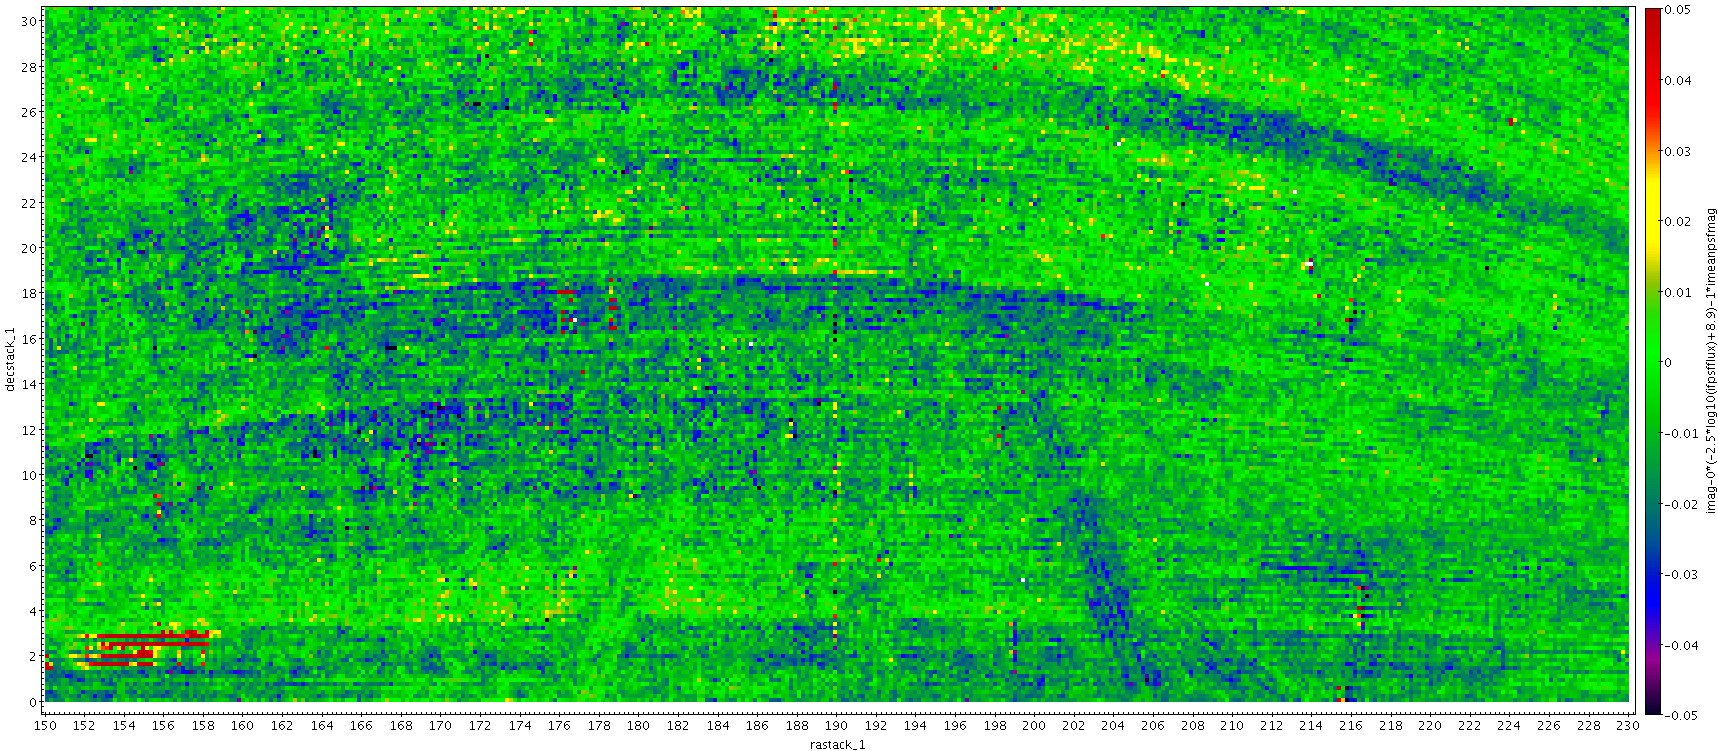
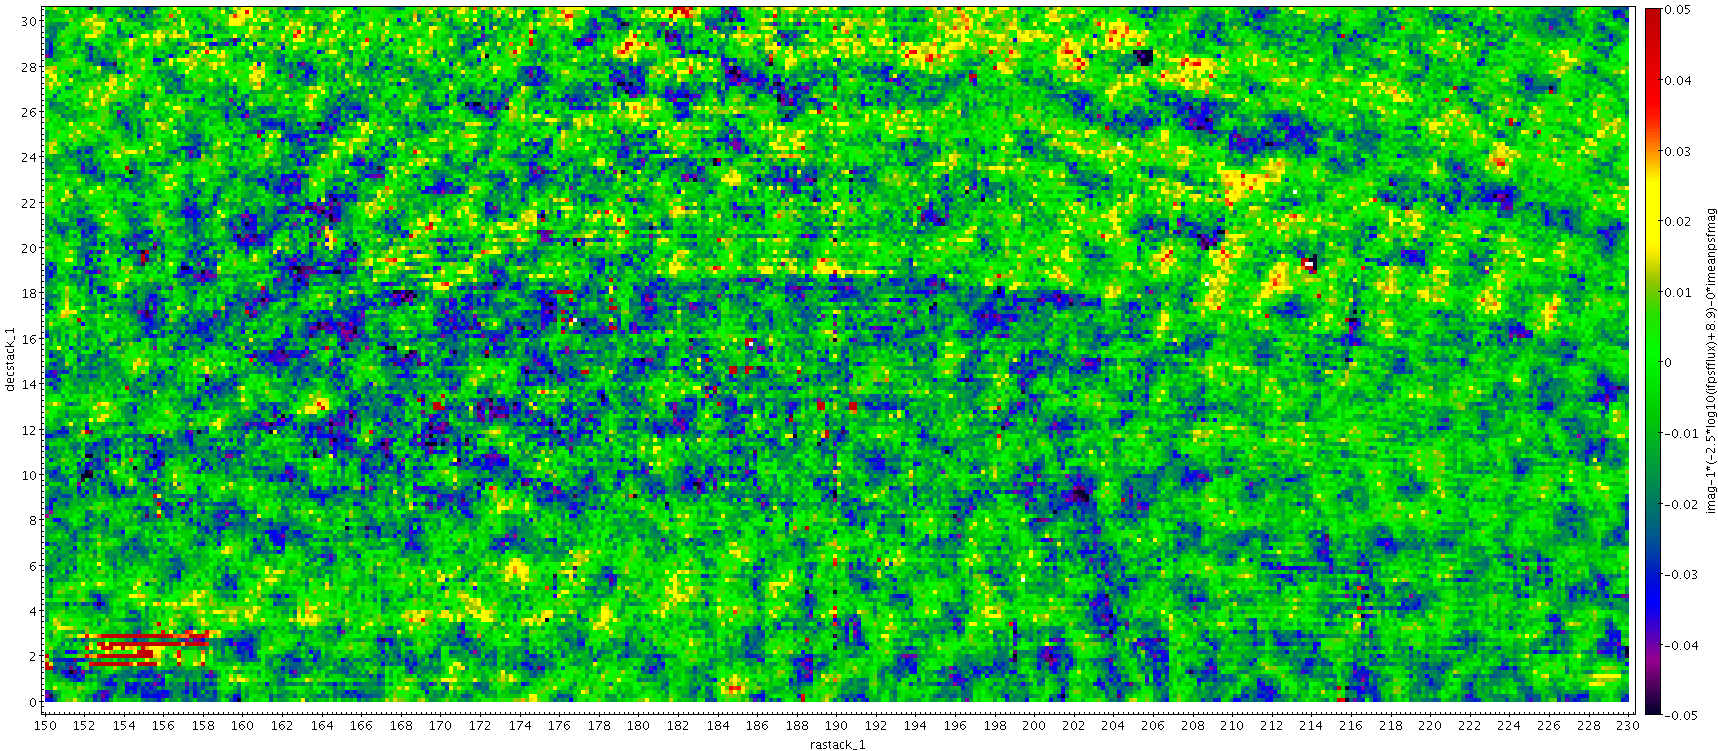
Incorrect flat-field pattern on stack and forced warp catalogue data
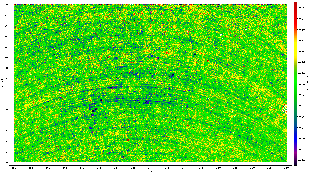
Residual flat fields errors (on the scale a few hundredths of a magnitude) on single exposures are corrected for at the catalogue stage. At one stage this correction was applied with the wrong sign. This was spotted and corrected in DR1 for the mean object data, but due to an oversight the stack and forced warp data (which rely on the mean object data for their ubercalibration) were not corrected. A residual flat field pattern can thus been seen in these data. All bands are affected to some extent, but the i-band is worst.
meanobject data - left - is fine, but the forced data (from ForcedMeanObjectView) - right - shows the residual FF pattern. The colour scale spans 0.1 mags purple to red, so the fluctuations are of order 0.03 mags. The arcs are the SDSS scan pattern by the way.
We expect this to fixed in DR2.
| SDSS - imeanpsfmag | SDSS - (-2.5*log10(ifpsfflux)+8.9) |
|---|---|
|
|