Page History
...
| Excerpt |
|---|
Users of the current PS1 DR2 data should be aware of a few issues and inconsistencies in the data.
|
...
The current version of the database (released 2019 January 28) is missing data over about 10.1% 016% of the survey (346 4.9 square degrees). The missing regions lie in areas where either no sources were ingested into the ObjectThin table (only ~1.5 sq deg), where the StackObjectThin objects were not added (~4.1 sq deg), or . Note that an earlier issue where the MeanObject objects are were missing (~341 sq deg). For the stack objects, the object entries are missing in ObjectThin, but they are present in StackObjectThin (and other stack tables). For the missing mean objects, the problem is that there are entries in ObjectThin but the corresponding magnitude information is missing from MeanObject. The effective result is that the objects do not show up in searches if any magnitudes or other properties are required (which is the usual case.)over a much larger area) has been fixed.
The figures below show where data are missing. The first figure shows a schematic plot with the locations of missing data. The other two plots show closeups with more detail. The most noticeable missing areas are long narrow strips in declination. The approximate boundaries of the missing data in declination strips are given in the table below.
...
The declination cut was not applied in a narrow RA strip between 214 and 216 degrees. In that region the catalog extends down to declination -36 deg. There some tables where additional information can be found on objects south of -30 deg (e.g., the Detection table). This data is unlikely to be of good quality due to uneven sky coverage. For most purposes data south of -30 deg should be ignored.
| Boundaries of regions with missing data | ||||||||||||||
|---|---|---|---|---|---|---|---|---|---|---|---|---|---|---|
| min(Dec) [deg] | max(Dec) [deg] | min(RA) [deg] | max(RA) [deg] | Missing objects | Notes | |||||||||
| 35.46 | 35.50499 | 189.0 | 267.7 | Stack Objects | ||||||||||
| 35.46 | 35.50499 | 0.0 | 4725.2 | Stack Objects | 24.7 | 27.8 | 0.0 | 68.1 | Mean Objects | 24.7 | 27.8 | 176.7 | 254.9 | Mean Objects |
| 37.40 | 37.44 | 0.0 | 47.2 | Mean Objects | Declination width varies | |||||||||
| 37.40 | 37.44 | 189.0 | 268.8 | Mean Objects | Declination width varies | |||||||||
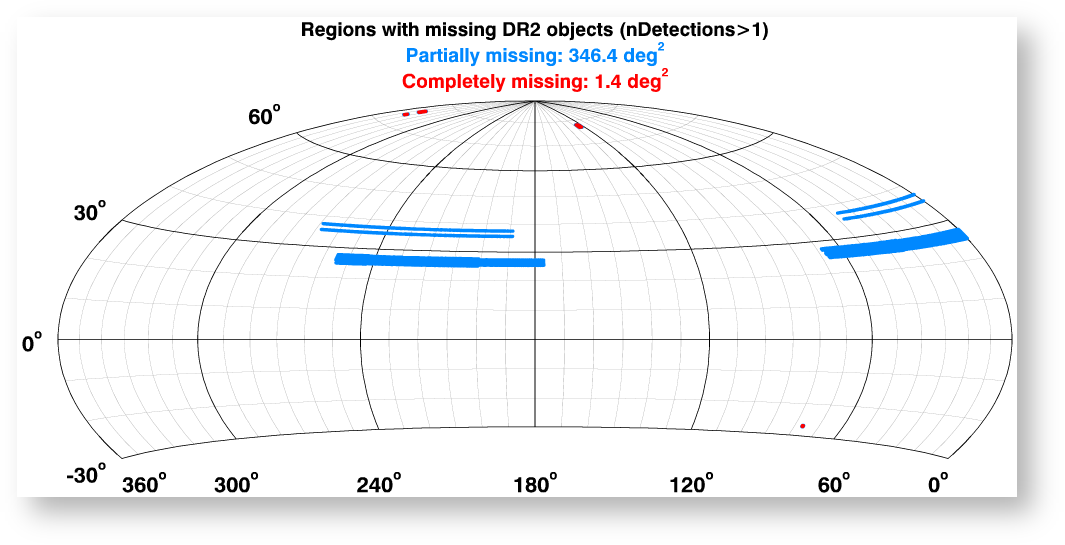
Figure showing regions where all objects are missing (red) and some objects are missing (blue).
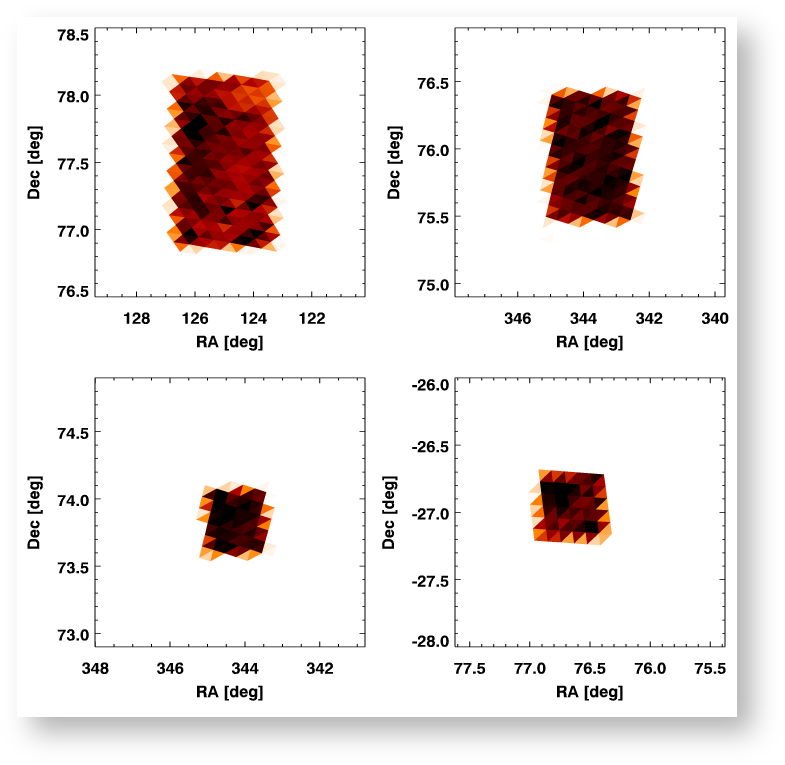
Figure showing closeups of the density of missing objects in the small holes.
...
| 31 | |||
| 35.46 | 35.499 | 25.88 | 47.25 |
| 76.88 | 78.11 | 123.34 | 126.66 |
| 75.47 | 76.40 | 342.51 | 345.00 |
| 73.60 | 74.06 | 343.50 | 345.00 |
| -27.18 | -26.72 | 76.40 | 76.91 |
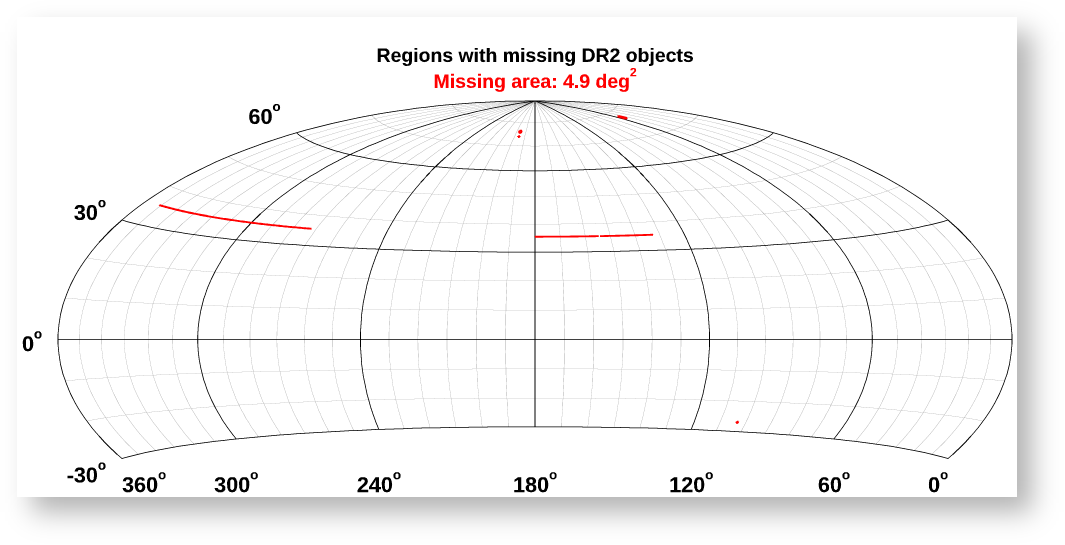
Figure showing regions where objects are missing.
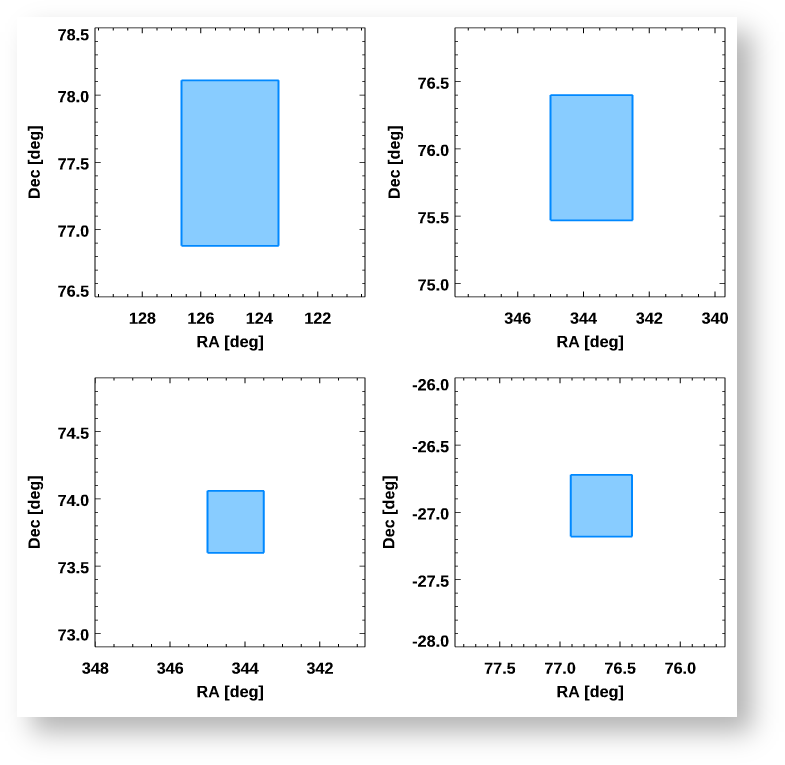
Figure showing closeups of small holes with missing objects.
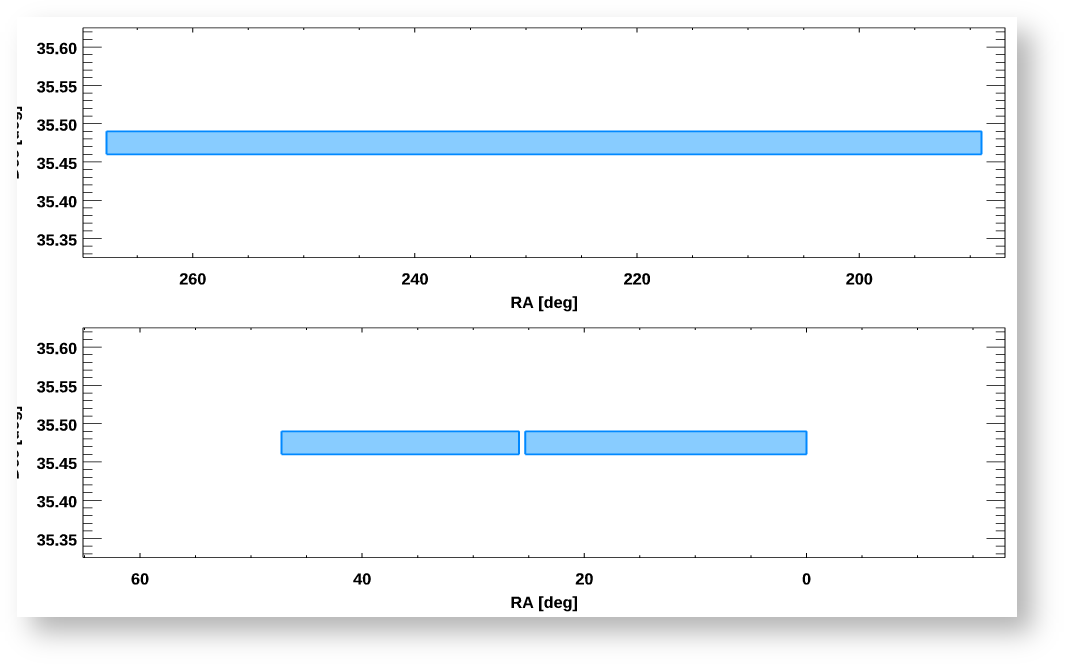
Figure showing details of missing declination strips. The top narrow strip is from missing stack objects,
while the other two are missing MeanObject entries. Note that the wide strip varies in declination widthNote the strips are narrow, so the y-scale is much different than the x-scale.
Astrometry differences between stack and mean positions
...