Page History
The PanSTARRS images are interpolated onto a regular grid of images that cover the sky. The grid consists of large 4°x4° projection cells that are centered on lines of constant declination spaced 4 degrees apart. For convenience of access, each projection cell is divided into a 10x10 grid of skycells, each 0.4°x0.4°. The skycells for a given projection cell share a seamless world coordinate system with the same tangent projection, so they can be easily pasted together to produce larger images. The pixel size is 0.25 arcsec, which is by design very close to the native image scale of the detector (0.258'').
| Tip | ||||||
|---|---|---|---|---|---|---|
| ||||||
|
Projection
Cellscells in the RINGS.V3
Tessellationtessellation
The PS1 image layout for the 3PI survey is called the RINGS.V3 tessellation. It was defined by Tamas Budavari to meet the goals of defining a regular image pattern with nearly square cells that covers the sky while minimizing redundant image overlap. The sizes of the large projection cells are approximately constant over the sky.
The projection cell centers are located on lines of constant declination spaced 4° apart. At a given declination, the pointing centers are equally spaced in right ascension around the sky, with the number of RA points changing to account for the convergence of RA lines in the spherical sky. The pattern is defined to cover the entire sky from δ = −90° to +90°. There are 46 declination zones numbered starting at 0 for an image at δ = −90°, 1 for a row of 9 images centered at δ = −86°, 2 at δ = −82°, and so on; the images in zones 22 and 23 are at δ = −2° and +2°, and zones 44 and 45 are at δ = +86° and +90° respectively.
Within a given declination zone, the projection cells are centered at RA(n) = n Δα = n 360°/M where M is the number of RA cells in the zone. Finally, the projection cells themselves are numbered consecutively (ordered by increasing RA) starting at 0 at the south pole, 1–9 at δ = −86°, etc.
Since the PS1 survey covers the sky only for δ > −30°, not all projection cells are used for PS1 images. The first PS1 projection cell above -30° is number 635 at RA=0°, δ = −30°, and the last one is 2643 at δ = +90°. The (There are a few scattered images at more southern declinations, so there is a small amount of data – but no stack images – in projection cells smaller than 635.) The table at the bottom gives the details on the number of cells in each row, the exact sizes of the images, etc.
Note that this tessellation applies to the PS1 3PI survey. For the Medium Deep Surveys (which do not yet have image products), special projection cells are used that are centered on each medium deep field.
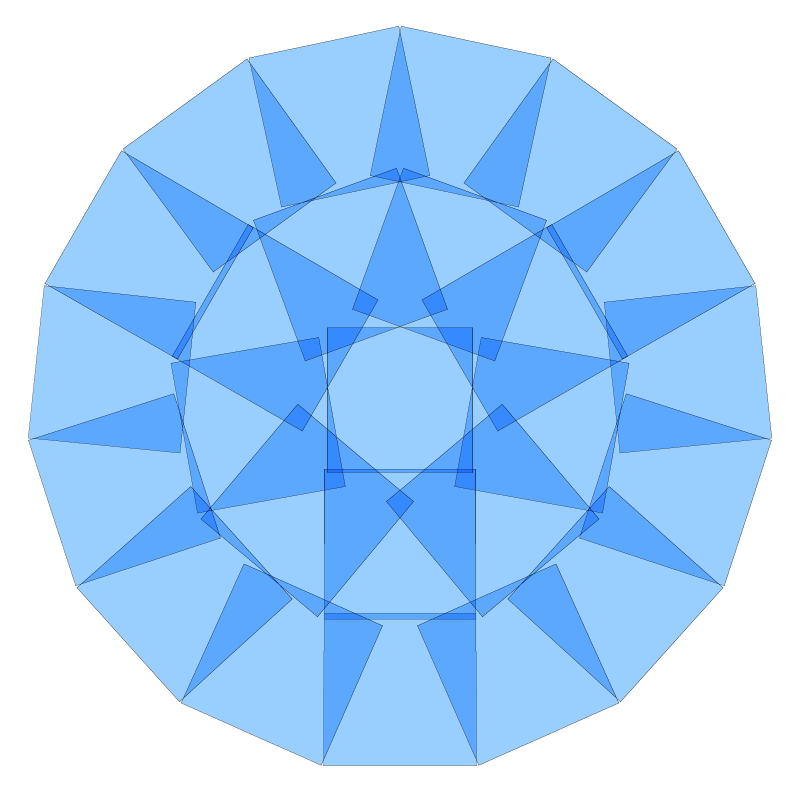
The figures below display the projection cells for the entire PS1 sky north of −30° and for the region around the north celestial pole.
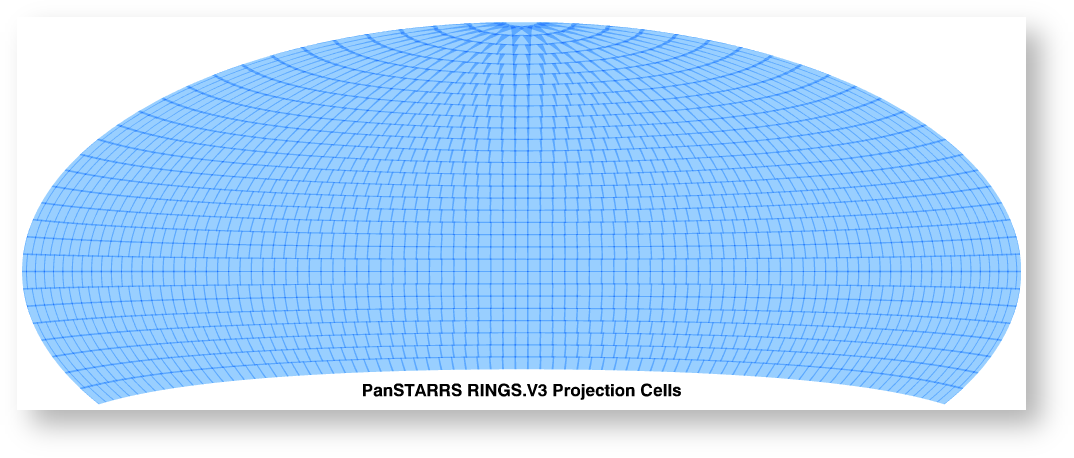
Figure 1: Aitoff plot of all 2,009 PS1 projection cells for the 3PI survey. The coverage extends from declination −30° to the north celestial pole.
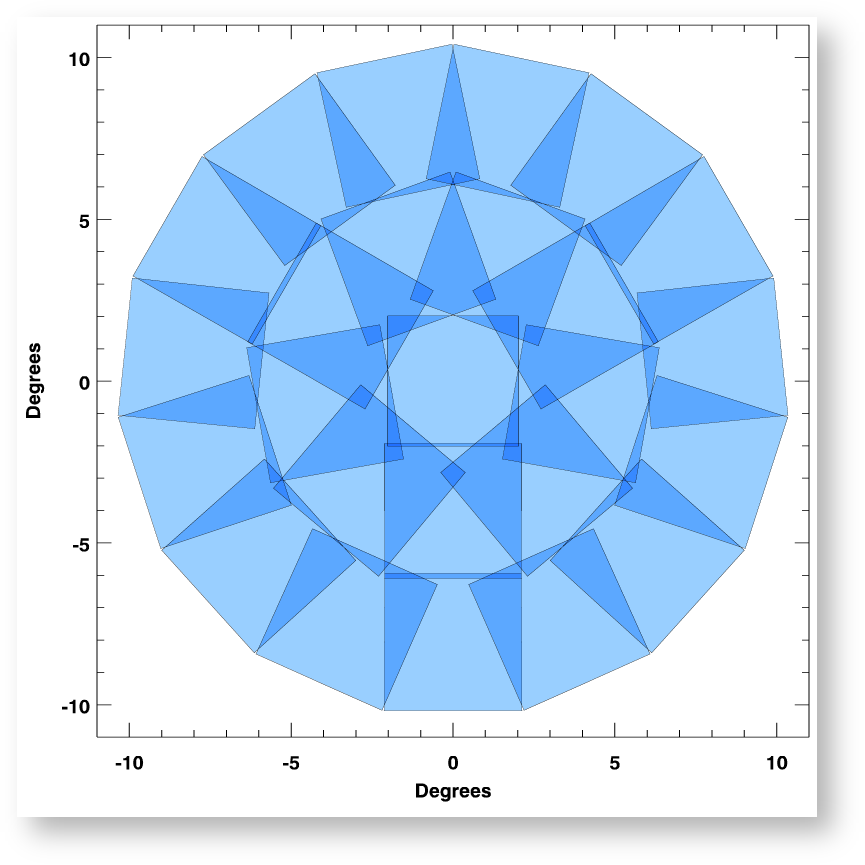
Figure 2: PS1 projection cells near the north celestial pole, where the image overlap is greatest due to convergence of the RA grid. The projection cells are 4°x4° in size and are on rings spaced by 4° in declination.
Note that the overlap regions between the projection cell centered on the north celestial pole and the neighboring cells are at some spots extremely small. In fact, the polar cell is currently slightly too small to create adequate overlap with the neighbors (Figure 3), so there is a gap in the PS1 sky coverage around RA=180°, Dec=87.97°. In that region there are no image pixels and no catalog coverage. The skycells that touch on the missing region are 2643.094 (from the polar image), 2638.093, and 2639.096. The missing region is small (~1.6x10⁻³ sq deg). In the future the data near the pole will be reprocessed to generate a larger image that has the necessary overlap.
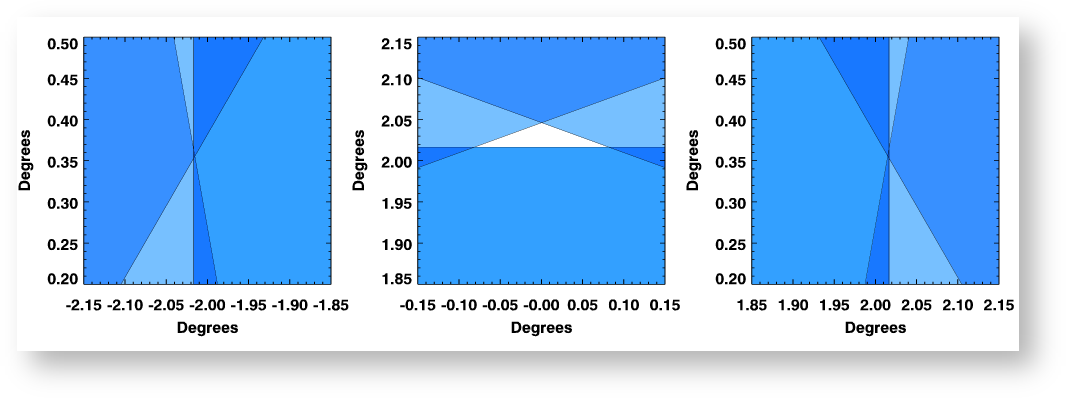
Figure 3: Closeup of PS1 projection cells near the north celestial pole showing regions where the overlap is small, or (in the case of the middle plot) has gaps between the images.
Skycells
The projection cell images would be large and inconvenient to download – they are typically about 63000x63000 pixels and so would be about 8 GB each. To make them easier to work with, each projection cell is divided into a grid of 10x10 skycells. The skycells are typically 0.4°x0.4° in size. These images are simple rectangular FITS images that share the same tangent world coordinate system with the original projection cell image (i.e., they have the same CRVAL1, CRVAL2, and pixel size). They can be pasted together to make a larger image.
Adjacent skycells within a projection cell overlap by 240 pixels (60 arcsec) at each edge with the neighboring skycells. Consequently, for objects and structures smaller than 2 arcmin it is generally not necessary to combine data from adjacent skycells.
Skycell images have names like skycell.nnnn.0yx where nnnn is the projection cell number (which ranges from 635 to 2643) and 0yx gives the skycell location in the image, with y and x ranging from 0 to 9 indicating the respective y and x section of the projection cell. The 000 skycell is in the bottom left corner of the projection cell, 010 is just above it, and 099 is in the upper right corner.
Projection Cell Table
The table below gives all the details on the PS1 projection cells. Zone is the declination row number, which starts at 0 at δ = −90°. ProjCell is the projection cell number for the first cell on that row. M is the number of cells in the row (so the projection cell number runs from ProjCell to ProjCell+M−1). Dec is the declination of the image center. Xsize and Ysize give the size of the full projection cell image in 0.25 arcsec pixels. Xsub and Ysub give the size of the skycell images into which the projection cell is divided for storage in FITS files. Note that Xsub = (Xsize-480)/10+240480 pixels. The final two columns, MinDec and MaxDec, give the declination range over which this row is the best choice. These These columns are used to select a declination zone in the region where adjacent zones overlap. (The actual algorithm used is a bit more complicated near the north pole, where a simple declination threshold is not sufficient to identify the best projection cell.)
There are no stack images available in zones 13 and 14. Coverage by individual exposures is very spotty south of −30° declination, although there are a few exposures and catalog objects there.
This table is also available as a FITS binary table.
Zone | ProjCell | M | Dec | Xsize | Ysize | Xsub | Ysub | MinDec | MaxDec |
|---|---|---|---|---|---|---|---|---|---|
| 13 | 487 | 72 | -38.0 | 58730 | 58470 | 6305 | 6279 | -39.986 | -35.987 |
| 14 | 559 | 76 | -34.0 | 58330 | 58420 | 6265 | 6274 | -35.987 | -31.989 |
15 | 635 | 79 | -30.0 |
58420 |
58370 |
6274 |
6269 | -31.989 | -27.991 | |
16 | 714 | 82 | -26.0 |
58230 |
58330 |
6255 |
6265 | -27.991 | -23.992 | |
17 | 796 | 84 | -22.0 |
58470 |
58290 |
6279 |
6261 | -23.992 | -19.993 | |
18 | 880 | 86 | -18.0 |
58420 |
58260 |
6274 |
6258 | -19.993 | -15.994 | |
19 | 966 | 88 | -14.0 |
58100 |
58220 |
6242 |
6254 | -15.994 | -11.996 | |
20 | 1054 | 89 | -10.0 |
58160 |
58180 |
6248 |
6250 | -11.996 | -7.997 | |
21 | 1143 | 89 | -6.0 |
58590 |
58150 |
6291 |
6247 | -7.997 | -3.998 | |
22 | 1232 | 90 | -2.0 |
58080 |
58110 |
6240 |
6243 | -3.998 | 0.000 | |
23 | 1322 | 90 | 2.0 |
58080 |
58110 |
6240 |
6243 | 0.000 | 3.998 | |
24 | 1412 | 89 | 6.0 |
58590 |
58150 |
6291 |
6247 | 3.998 | 7.997 | |
25 | 1501 | 89 | 10.0 |
58160 |
58180 |
6248 |
6250 | 7.997 | 11.996 | |
26 | 1590 | 88 | 14.0 |
58100 |
58220 |
6242 |
6254 | 11.996 | 15.994 | |
27 | 1678 | 86 | 18.0 |
58420 |
58260 |
6274 |
6258 | 15.994 | 19.993 | |
28 | 1764 | 84 | 22.0 |
58470 |
58290 |
6279 |
6261 | 19.993 | 23.992 | |
29 | 1848 | 82 | 26.0 |
58230 |
58330 |
6255 |
6265 | 23.992 | 27.991 | |
30 | 1930 | 79 | 30.0 |
58420 |
58370 |
6274 |
6269 | 27.991 | 31.989 | |
31 | 2009 | 76 | 34.0 |
58330 |
58420 |
6265 |
6274 | 31.989 | 35.987 | |
32 | 2085 | 72 | 38.0 |
58730 |
58470 |
6305 |
6279 | 35.987 | 39.986 | |
33 | 2157 | 68 | 42.0 |
58880 |
58520 |
6320 |
6284 | 39.986 | 43.984 | |
34 | 2225 | 64 | 46.0 |
58750 |
58570 |
6307 |
6289 | 43.984 | 47.982 | |
35 | 2289 | 60 | 50.0 |
58290 |
58630 |
6261 |
6295 | 47.982 | 51.980 | |
36 | 2349 | 55 | 54.0 |
58510 |
58700 |
6283 |
6302 | 51.980 | 55.977 | |
37 | 2404 | 50 | 58.0 |
58460 |
58790 |
6278 |
6311 | 55.977 | 59.974 | |
38 | 2454 | 45 | 62.0 |
58080 |
58870 |
6240 |
6319 | 59.974 | 63.970 | |
39 | 2499 | 39 | 66.0 |
58750 |
59010 |
6307 |
6333 | 63.970 | 67.965 | |
40 | 2538 | 33 | 70.0 |
59330 |
59180 |
6365 |
6350 | 67.965 | 71.958 | |
41 | 2571 | 27 | 74.0 |
59810 |
59390 |
6413 |
6371 | 71.958 | 75.950 | |
42 | 2598 | 21 | 78.0 |
60200 |
59660 |
6452 |
6398 | 75.950 | 79. |
940 | |||
43 | 2619 | 15 | 82.0 |
60490 |
59970 |
6481 |
6429 | 79. |
940 | 83. |
936 | |||
44 | 2634 | 9 | 86.0 |
60690 |
59870 |
6501 |
6419 | 83. |
936 | 87. |
969 | |||
45 | 2643 | 1 | 90.0 |
58080 |
58080 |
6240 |
6240 | 87. |
969 | 90.000 |
| PS1 Image Grid Layout | |
|---|---|
| Projection cell size | ~ 4° × 4° |
| Pixel size | 0.25 arcsec |
| No. of projection cells | 2,009 |
| Declination spacing | 4° |
| Skycell size | ~ 0.4° × 0.4° |
| No. of skycells | ~ 200,000 |
| Skycell edge overlap | 240 pixels = 60" |