The Pan-STARRS telescope surveyed the sky in several different areas using various observing strategies. The 3PI survey covers the 30,000 deg2 (3 steradians) of sky north of Declination -30º in 5 filters (grizy) with approximately 10 exposures per filter to a combined depth of approximately 21-23 mag. The Medium Deep Survey covers 10 fields, each about 7 deg2, with hundreds to thousands of exposures per filter to reach a combined depth of 24–26 mag. Other secondary surveys (M31 survey, ecliptic plane survey, celestial north pole) also were carried out. The initial PS1 data release includes only the 3PI survey, but other data will be released as processing is completed.
Information for this page should come from/be consistent with Chambers et al 2016.
Parent page for description of the surveys. Outline of things to include:
- Summary table:
- Bright limits
- Locations and areal coverage versus time
- Data-taking statistics: numbers of visits, quality, etc.
- 3pi Survey (3PI):
- Definition in terms of coverage maps, depth, observing cadences
- Medium Deep Survey(MDS):
- Location on sky, depth, observing cadences
3PI Survey
The 3PI Survey covers the sky north of -30º in 5 filters (grizy). Individual pointing exposure times in seconds are shown below.
| g | r | i | z | y |
|---|---|---|---|---|
| 43 | 40 | 45 | 30 | 30 |
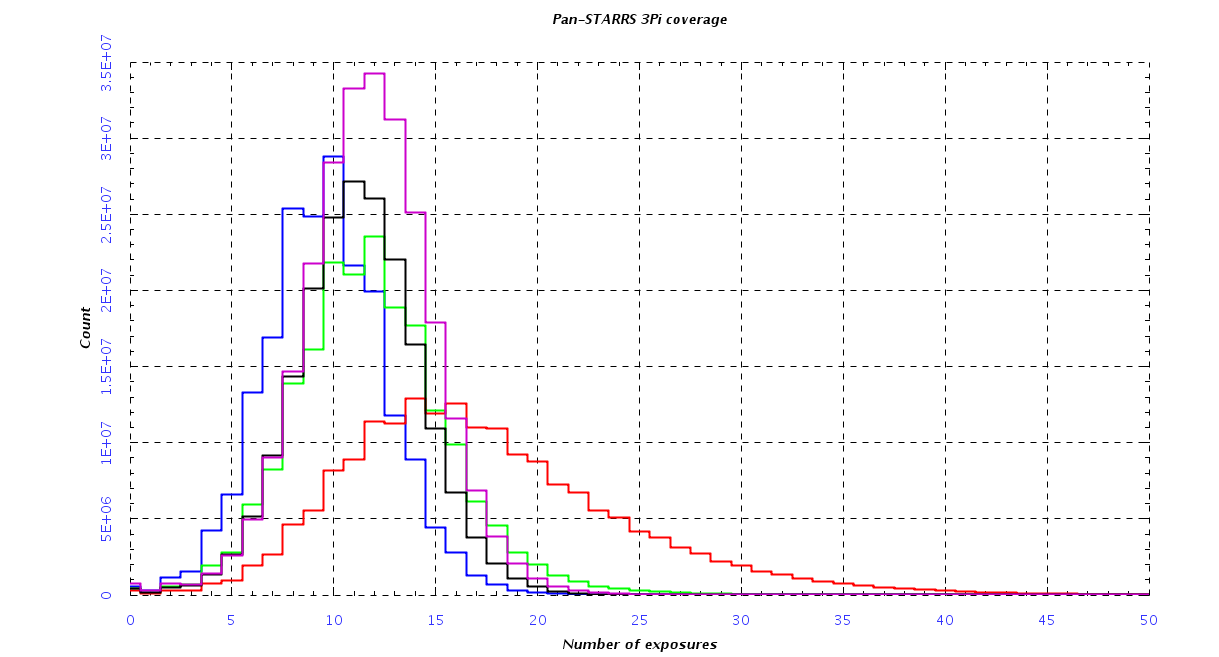
There are typically a dozen pointings in each filter, with the pointing centers dithered to enable the construction of a seamless image that fills in regions of bad pixels in most parts of the sky. A typical point in the sky has about 10 pointings available. The table below shows the mean number of pointings and its rms variation over the whole survey as a function of band (taken from an all sky-projection based on the summary stacks, which have a resolution of 4'' per pixel).
| g | r | i | z | y |
|---|---|---|---|---|
| 9.6±3.0 | 11.8±3.8 | 17.4±6.9 | 11.2±3.0 | 11.7±3.2 |
Below is a histogram showing the coverage distributions (blue - g; green - r; red - i; black - z; purple - y)
The median seeing in the images is ~1.1" FWHM (ranging from 1.3'' in g to 1.02'' in y). The cumulative FWHM distributions in each filter are shown below (green - g; red - r; orange - i; blue - z; yellow - y).

The 5σ point source depth is given in the table below for both the individual exposures and the stacked image sum.
| Image Data | g limit | r limit | i limit | z limit | y limit |
| Single epoch | 22.2 | 22.0 | 21.5 | 20.8 | 19.8 |
| Stacked sum | 23.4 | 23.2 | 22.7 | 22.0 | 21.1 |
Saturation occurs roughly at point source magnitudes of 14.5, 15, 15, 14, 13 for grizy respectively.
Medium Deep Survey
The 10 fields in the Medium Deep Survey are described below. Each field was observed several times a night during the months of the year when it was observable. In total there are hundreds to thousands of exposures in each of the 5 filters (grizy), enabling the construction of very deep stacked images. The depth of individual exposures is the same as for the 3PI survey in the table above; the depth of the stacked image sum is shown below.
| Name | Alt Name | RA (deg) | Dec (deg) | g limit | r limit | i limit | z limit | y limit | RA (J2000) | Dec (J2000) | Comment |
| PS1MD01 | XMM-LSS-DXS/VVDS-02h | 35.875 | -4.250 | 25.9 | 25.8 | 26.0 | 25.6 | 24.3 | 02 23 30 | -04 15 00 | Multi-wavelength Survey Field |
| PS1MD02 | CDFS/GOODS/GEMS | 53.100 | -27.800 | 25.6 | 25.4 | 25.8 | 25.3 | 24.1 | 03 32 24 | -27 48 00 | Multi-wavelength Survey Field |
| PS1MD03 | IFA/Lynx | 130.592 | +44.317 | 25.8 | 25.8 | 26.0 | 25.6 | 24.3 | 08 42 22 | +44 19 00 | Radio Survey Field |
| PS1MD04 | COSMOS | 150.000 | +2.200 | 25.8 | 25.7 | 25.8 | 25.4 | 24.0 | 10 00 00 | +02 12 00 | Multi-wavelength Survey Field |
| PS1MD05 | Lockman-DXS | 161.917 | +58.083 | 25.8 | 25.7 | 25.9 | 25.4 | 23.9 | 10 47 40 | +58 05 00 | Multi-wavelength Survey Field |
| PS1MD06 | NGC 4258 | 185.000 | +47.117 | 25.8 | 25.6 | 25.9 | 25.3 | 23.9 | 12 20 00 | +47 07 00 | H20 Maser |
| PS1MD07 | DEEP2 Field 1/Extended Groth Strip | 213.704 | +53.083 | 25.8 | 25.7 | 25.9 | 25.4 | 24.1 | 14 14 49 | +53 05 00 | Multi-wavelength Survey Field |
| PS1MD08 | ELAIS-N1-DXS | 242.787 | +54.950 | 25.9 | 25.8 | 26.0 | 25.4 | 24.2 | 16 11 09 | +54 57 00 | Multi-wavelength Survey Field |
| PS1MD09 | SA22-DXS/VVDS-22h | 334.188 | +0.283 | 26.0 | 25.9 | 26.1 | 25.6 | 24.1 | 22 16 45 | +00 17 00 | Multi-wavelength Survey Field |
| PS1MD10 | DEEP2-Field3 | 352.312 | -0.433 | 25.9 | 25.8 | 26.1 | 25.6 | 24.1 | 23 29 15 | -00 26 00 | Multi-wavelength Survey Field |
The detection limits come from a 2015 January analysis by Nigel Metcalfe and will probably change in the final processing. They are 5-sigma point source detection limits calculated from the databases by measuring (roughly) where psfflux_err/psfflux=0.2.