Page History
This page is still being populated. Please be patient. We will provide the answers over the next few weeksmore answers as time allows.
| Table of Contents |
|---|
The Pan-STARRS project
What is Pan-STARRS? Why was it done?
What types of data were obtained? What can they tell me about the sky?
How does PS1 compare to other surveys such as the Sloan Digital Sky Survey (SDSS)?
PS1 data access
What should I know about the current data release?
| Excerpt Include | ||||||
|---|---|---|---|---|---|---|
|
See the PS1 DR1 caveats page for more information.
How do I get started? Are there examples of data queries?
How do I get PS1 data for a list of sources I have?
What tools are available to extract and examine PS1 data?
How do I access PS1 image data?
PS1 catalog data
How do I make sense of the entries in the PS1 data tables?
The PS1 databases are complex, with information stored in many different tables. The PS1 Sample queries page gives some examples that can be helpful in getting an overview of the use of the tables. The PS1 Database object and detection tables page has detailed descriptions of the tables that have data on individual objects. You can search within this page for particular columns or quantities. There are other pages that describe tables with observational metadata (e.g., exposure dates and times) and catalog metadata (e.g., information on flags).
How can I distinguish stars from galaxies in the catalog?
There are several possible approaches to separate extended objects from point sources. See the page describing how to separate stars and galaxies for suggested approaches.
PS1 astrometry
How good is PS1 astrometry?
PS1 photometry
What filters did PS1 use?
The PS1 camera surveyed the sky using 5 filters: g, r, i, z, and y. The effective wavelengths (and spectral resolutions) of these 5 filters are 481 nm (R = 3.5), 617 nm (R = 4.4), 752 nm (R = 5.8), 866 nm (R = 8.3), and 962 nm (R = 11.6), respectively. Please refer to Table 4 in Tonry et al. (2012) for bandpass details. Schlafly et al. (2012) provides updated zeropoints in Table 1.
How good is PS1 photometry?
The PS1 photometric system is shown by Schlafly et al. (2012) to have reliability across the survey region at the level of (8.0, 7.0, 9.0, 10.7, 12.4) millimags in (g, r, i, z, y). The Haleakala site is good enough to enable <1% photometry over much of the sky. The PS1 photometric calibration pipeline process is described in Magnier et al. (2016).
Which magnitudes should I use?
There are several different kinds of magnitudes in the PS1 catalog (aperture, PSF-fitting, Kron, etc.), and there are also several different sources for those magnitudes (means from multi-epoch measurements, measurements from deep stack images, "forced mean" measurements where a stack image is used to identify objects but the photometry is determined by fits to the single-epoch warp images). Which magnitude should you used for your science?
...
- For point sources use PSF magnitudes.
- Mean PSF magnitudes have the lowest noise (because the PSF model is most accurate in single-epoch images). They are good for brighter objects, but for objects near the single-epoch detection limit they will be biased (due to the absence of sub-threshold detections), and objects too faint to detect in a single epoch are missing.
- Stack PSF magnitudes are noisier because the PSF model is less accurate. But the stack detections are more than a magnitude deeper and so have many more faint objects than mean detections.
- Forced mean PSF magnitudes use PSF-fitting photometry on the single-epoch images at positions of stack detections. They are a reasonable compromise: they have slightly lower noise than the stack PSF magnitudes, and they are deep and unbiased (because they use data from all warps). Their noise is higher than the mean PSF magnitudes, however.
- For extended objects use Kron magnitudes.
- Stack Kron magnitudes are usually the first choice as a general-purpose, deep magnitude.
- de Vaucouleurs and exponential model fits could be better in some cases, and the mean measurements can be useful for objects that are barely resolved (where the PSF is important).
- Extended object photometry using the PS1 catalog will require research and analysis by the user to determine the best approach.
What are the brightest and faintest stars for which the data are reliable?
The answer is it depends on band and FWHM. A very conservative estimate for the bright limit is as follows:
...
The faint limits vary across the sky - see the section on the photometric depth.
How reliable is PS1 photometry of nearby, bright galaxies?
There are two main problems you should be aware of which affect bright galaxies:
...
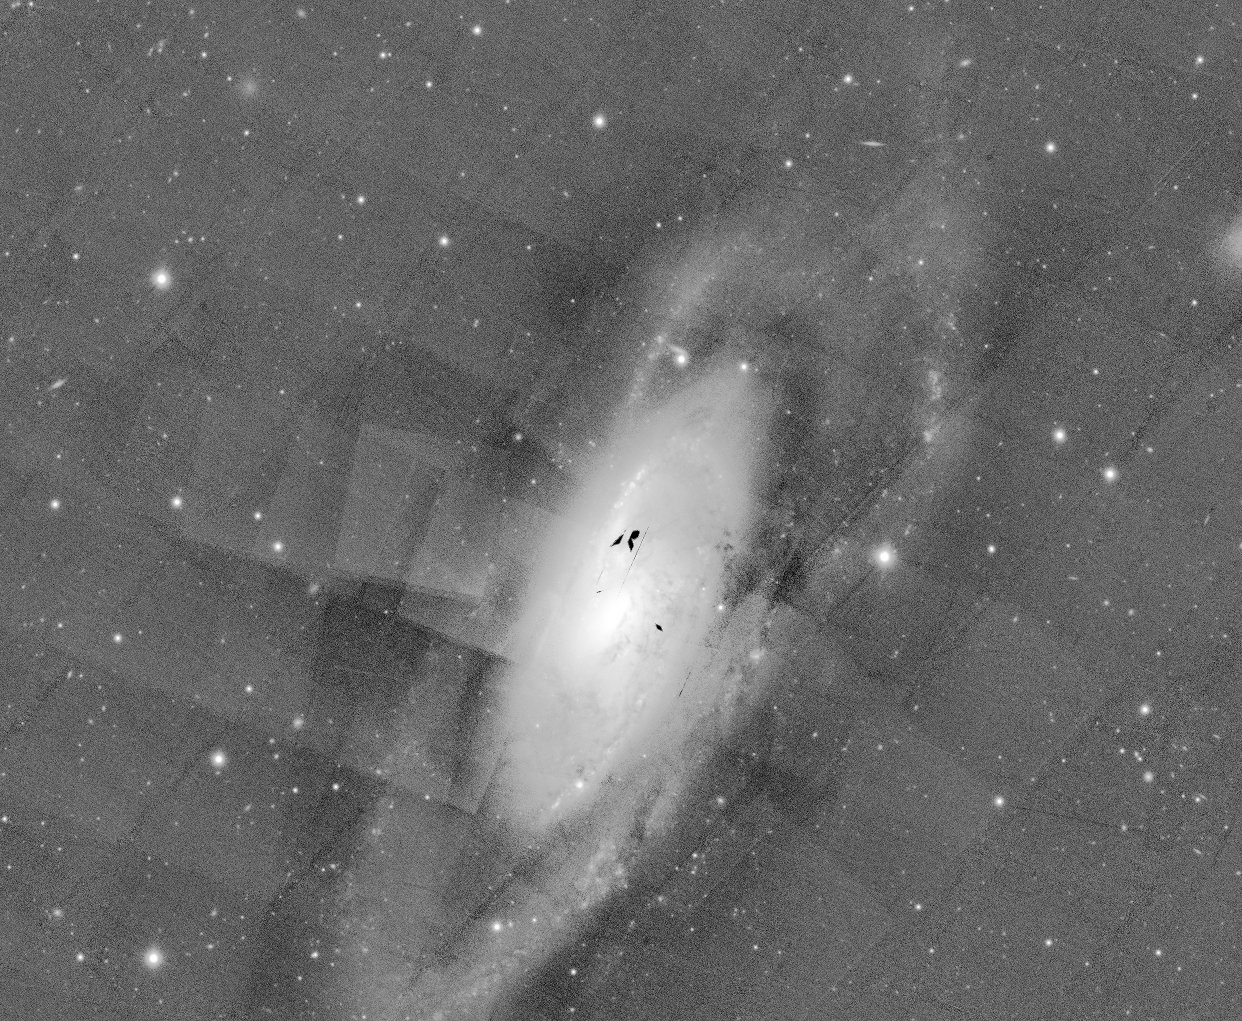 | Messier 106 - this is an extreme stretch of the r-band stack showing problems on the scale of individual ccds. |
|---|
Why is my photometry from images so different from the catalog photometry?
The pixel values in PS1 images must be transformed using a non-linear equation to convert them to fluxes before doing photometry on them. If you do not apply that transform, the photometry results will not be remotely close to the correct photometry. (Note that this transformation is required for full skycell images; smaller cutout images have already been converted to linear fluxes.)
...