Page History
...
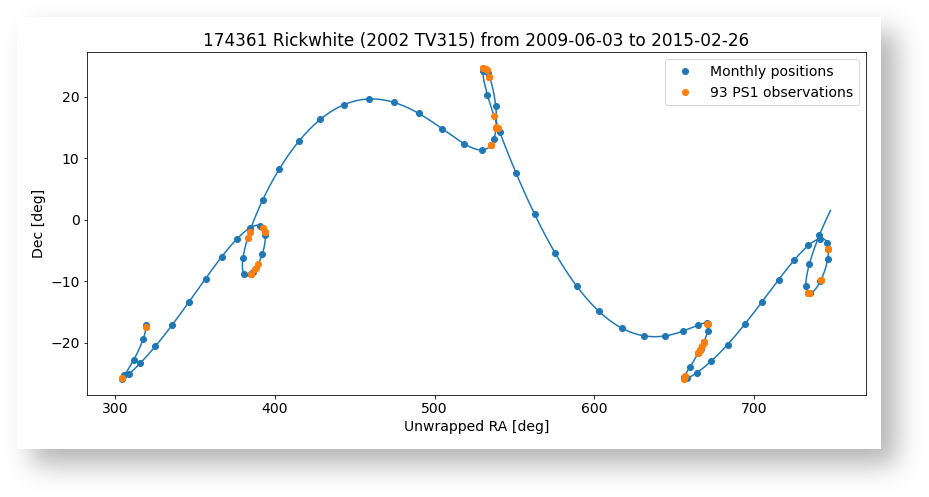
The notebook extracts the path the object followed during the PS1 survey (a period of about 5 years). Here is a plot of the path plus the positions of PS1 observations.
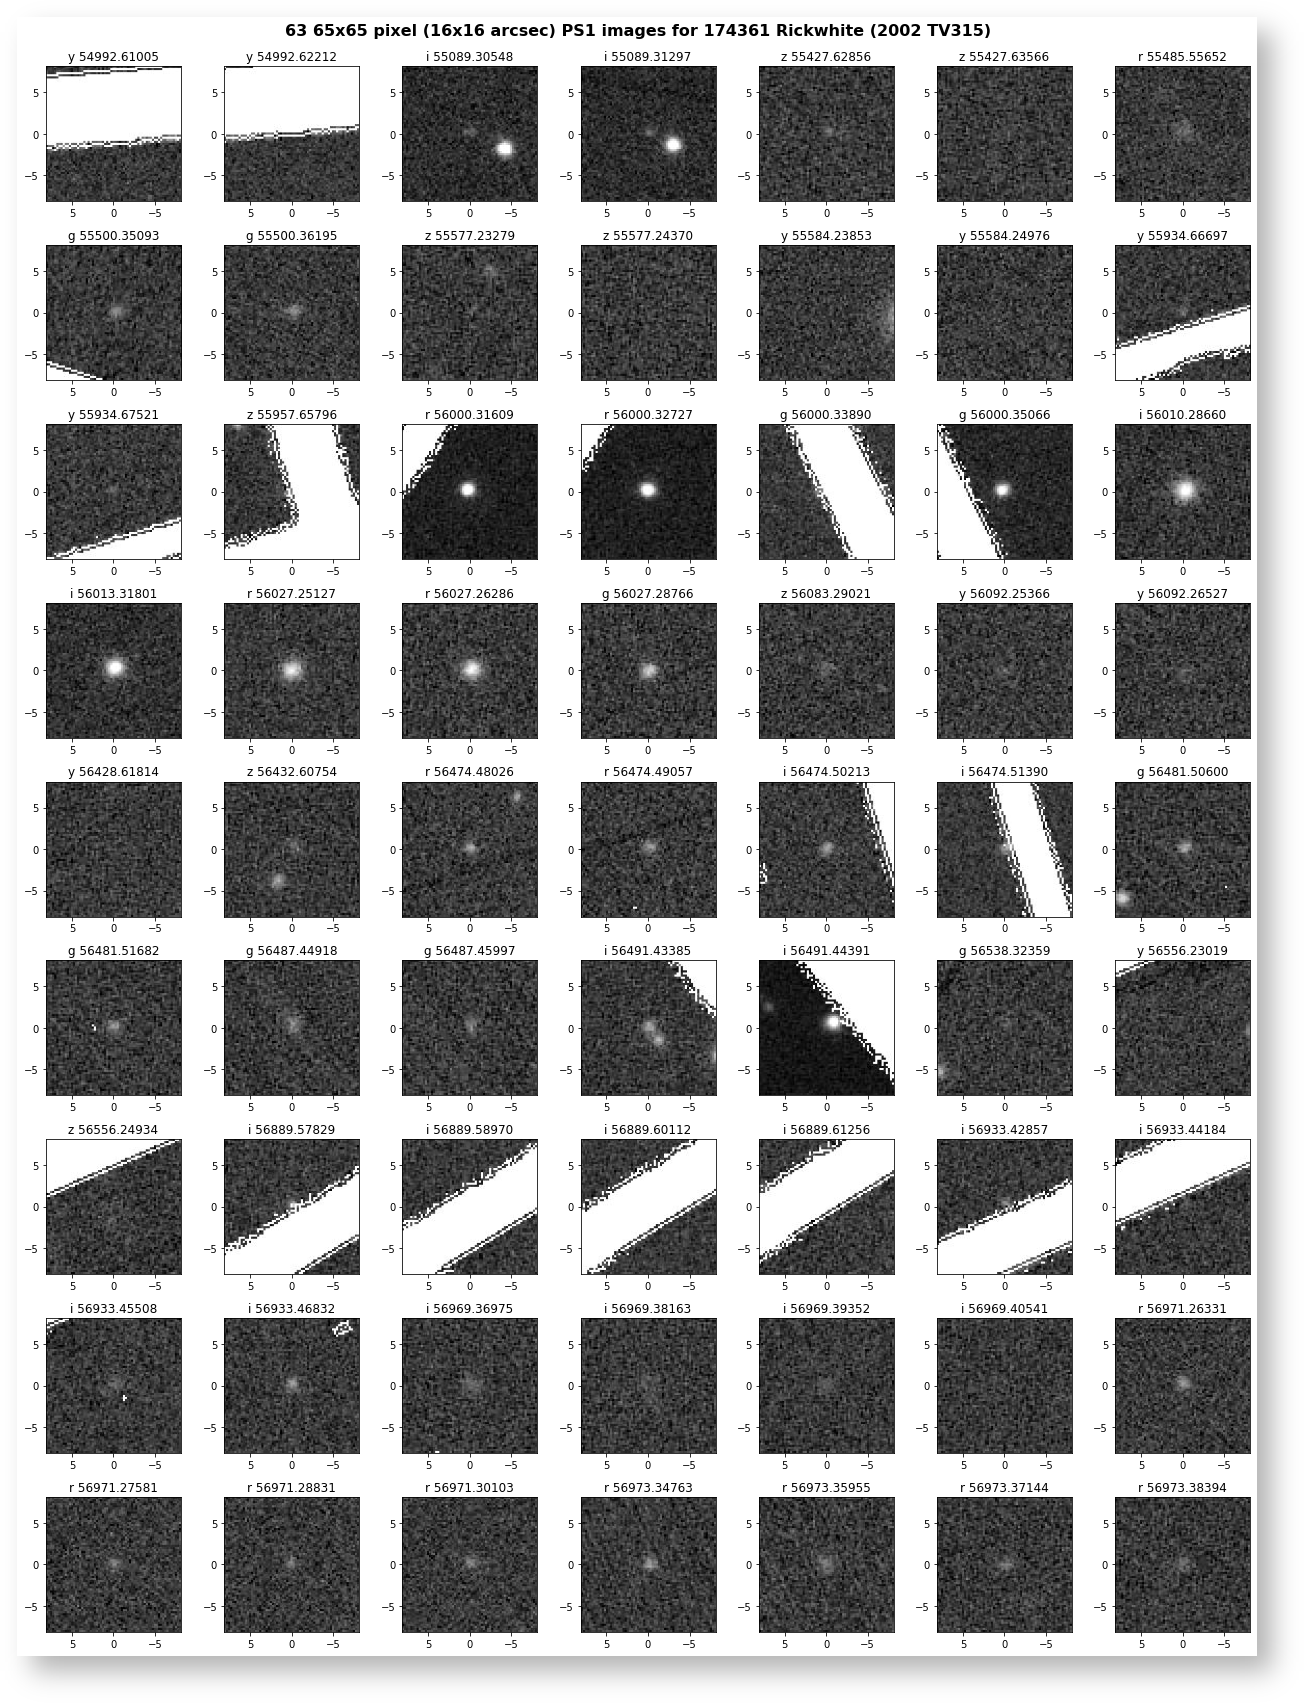
Here are the 63 images that include asteroid Rickwhite. These are 65x65 pixel cutouts (about 16x16 arcsec) centered on the ephemeris position. Some images fall in gaps between the chips, but for the other cases there is usually a faint object present at the expected location. The title on each plot gives the filter and MJD date for the observation.
Matching the list of object positions with the PS1 catalog finds 46 detections. Here is another plot of the images with the PS1 source position overplotted. Cases where there are bad pixels overlapping the object (as indicated by the psQfPerfect column) are marked in orange. Good measurements are marked in blue.
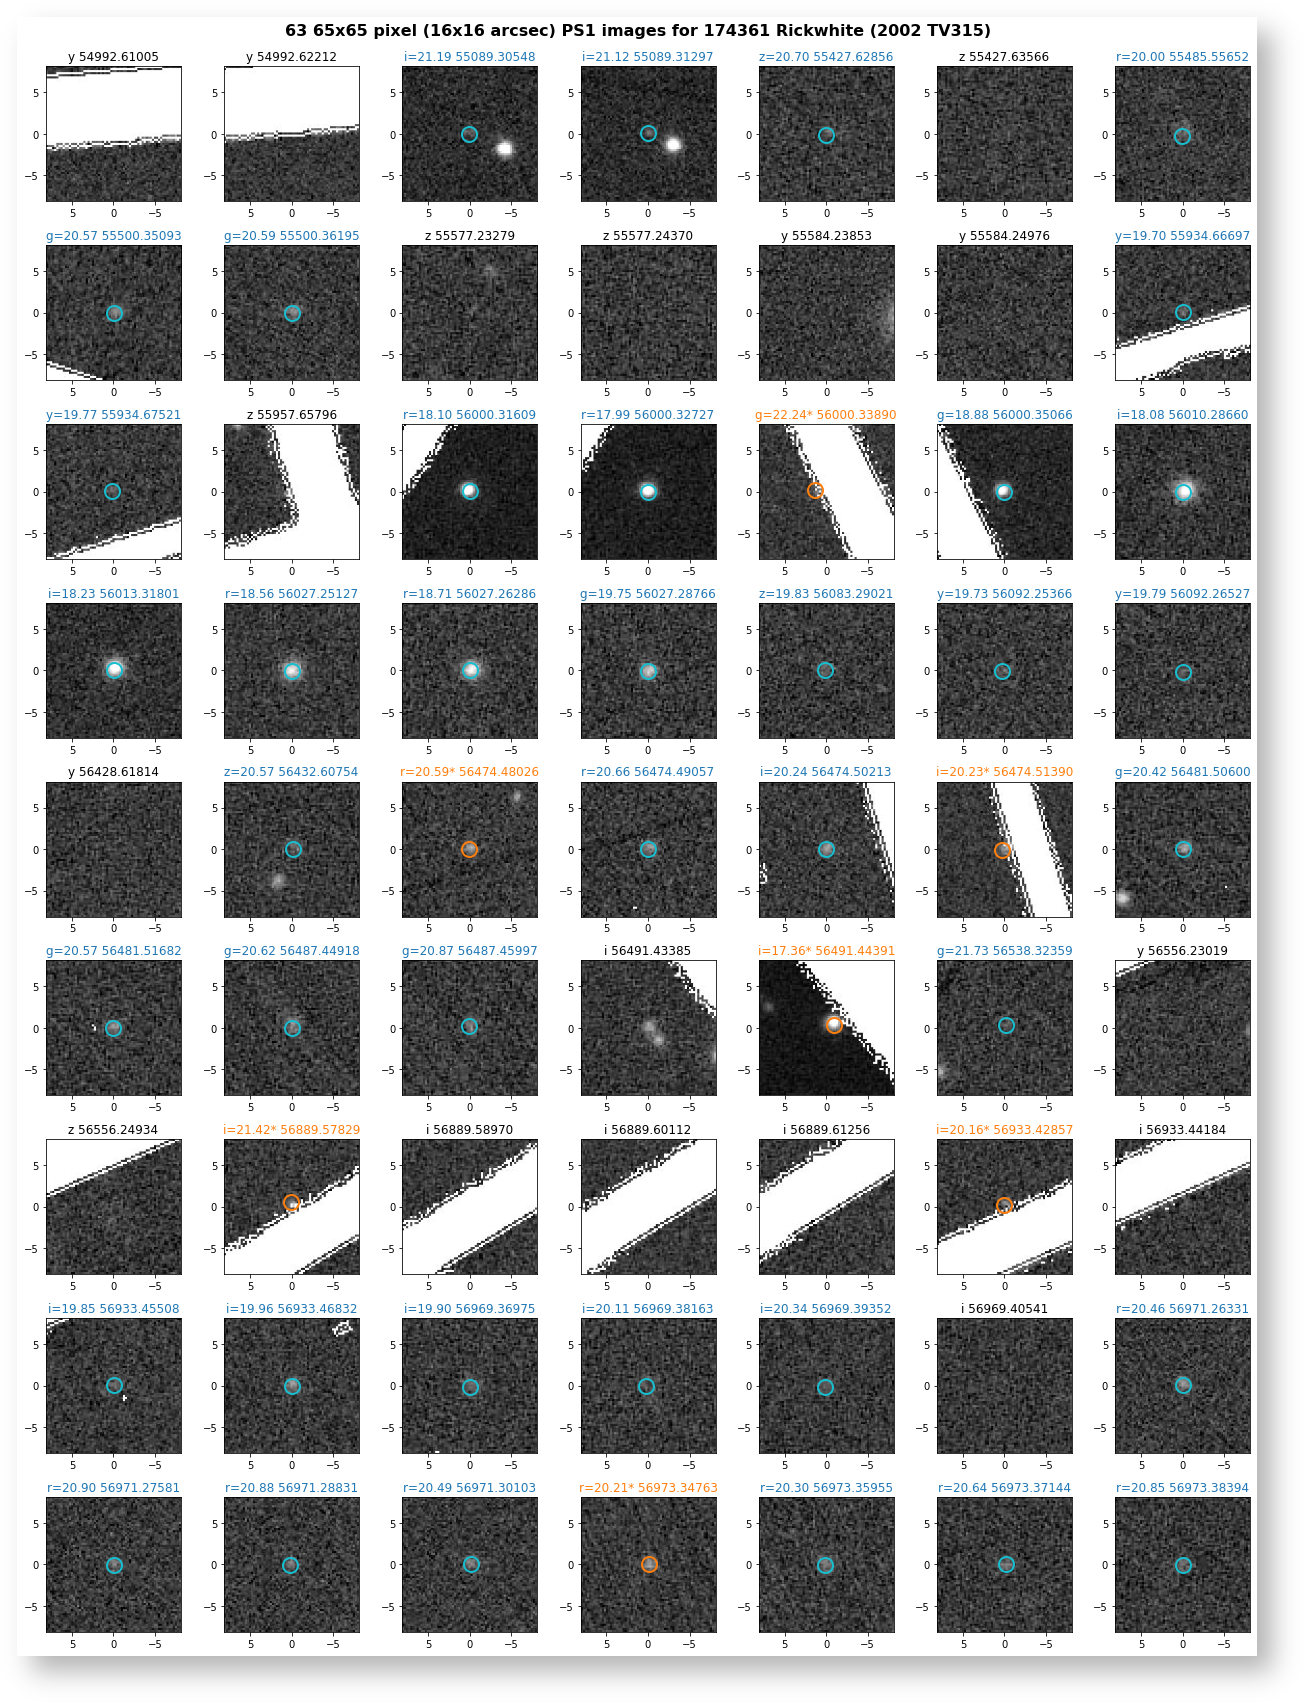
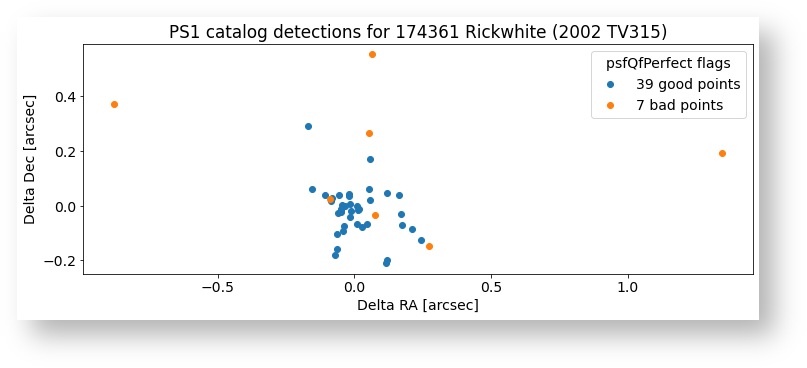
The third plot compares the positions from the PS1 catalog with the ephemeris positions from the JPL Horizons system. Again the objects with poorer quality data are plotted in orange. The 39 objects having good data agree very well with the predicted positions.
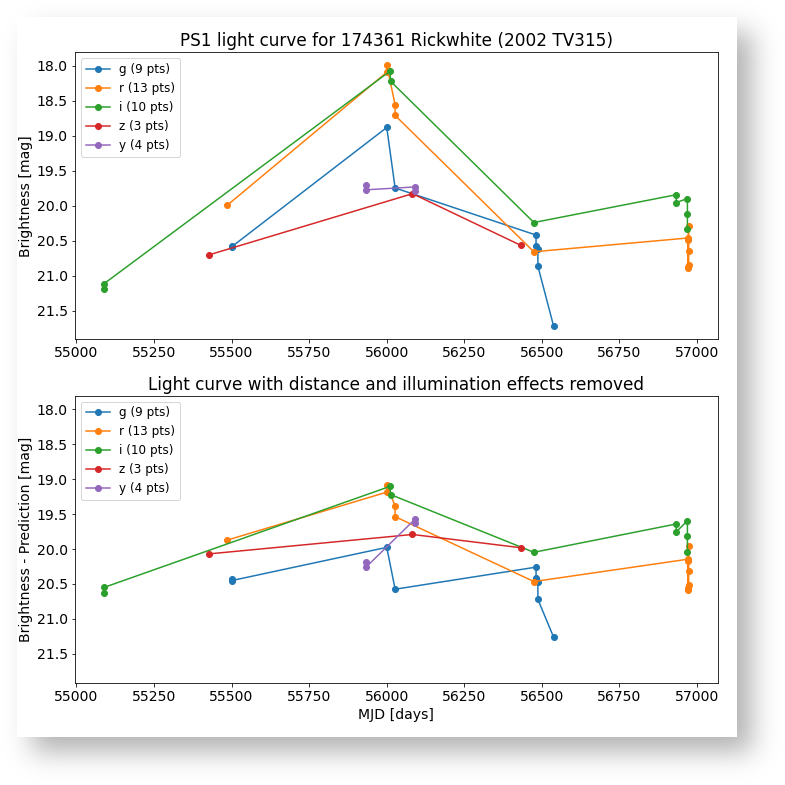
 It is noticeable that the brightness varies over a wide range in the images. Some of that is due to the different PS1 filters, but most of the variation is the result of changes in the distance between the Earth and the asteroid (it looks much fainter when farther away) and changes in the illumination fraction of the visible source. Asteroids have phases like the moon: the "full moon" view is brighter than a "half moon" or "crescent" view where the asteroid is only partly illuminated. The final plot shows the light curve from the PS1 data. The top panel shows the magnitude, with different filters shown in different colors. The asteroid varies in brightness by 3.5 magnitudes (a factor of 25). The plot shows the brightest measurements (with the smallest magnitudes) at the top.
The bottom panel shows the magnitudes adjusted using the asteroid's distance and illumination fraction (both quantities that are included in the JPL Horizons results). That removes much of the variation in apparent brightness, leaving behind other intrinsic factors such as the color (the asteroid is fainted in the blue g band and brightest in the i band) and other sources such as surface features. A more sophisticated model would be required to extract astrophysically interesting results from these observations.