Page History
...
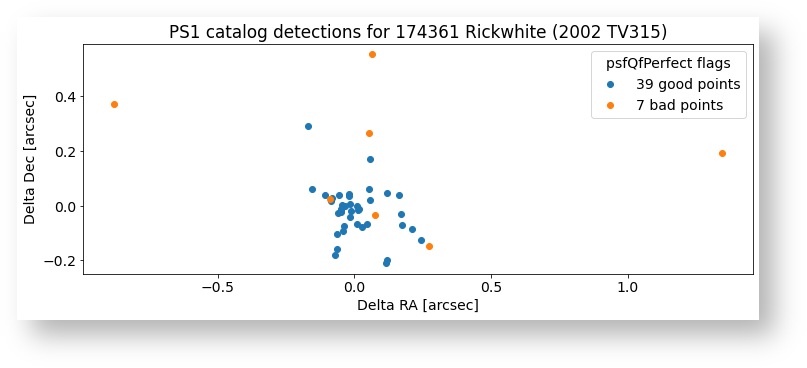
Here are some plots from the notebook showing the results. The PS1 survey has typically 10 epochs for each of the five filters (grizy) spread over the 5 years of observing. Those images will randomly include a moving object if they happen to be pointing in the right direction. The number of images with data will vary from object to object, but about 50 epochs will be the expected average.
...
 It is noticeable that the brightness varies over a wide range in the images. Some of that is due to the different PS1 filters, but most of the variation is the result of changes in the distance between the Earth and the asteroid (it looks much fainter when farther away) and changes in the illumination fraction of the visible source. Asteroids have phases like the moon: the "full moon" view is brighter than a "half moon" or "crescent" view where the asteroid is only partly illuminated. The final plot shows the light curve from the PS1 data. The top panel shows the magnitude, with different filters shown in different colors. The asteroid varies in brightness by 3.5 magnitudes (a factor of 25). Note that by the definition of magnitude, the faintest measurements are at the top (I will probably fix that)The plot shows the brightest measurements (with the smallest magnitudes) at the top.
The bottom panel shows the magnitudes adjusted using the asteroid's distance and illumination fraction (both quantities that are included in the JPL Horizons results). That removes much of the variation in apparent brightness, leaving behind other intrinsic factors such as the color (the asteroid is fainted in the bluest blue g band and brightest in the i band) and other sources such as surface features. A more sophisticated model would be required to extract astrophysically interesting results from these observations.
...