Page History
...
| Tip | ||||||
|---|---|---|---|---|---|---|
| ||||||
|
Missing data
The current version of the database (released 2019 January 28) is missing data over about 1.1% of the survey (346 square degrees). The missing regions lie in areas where either no sources were ingested into the ObjectThin table (only ~1.5 sq deg), where the StackObjectThin objects were not added (~4.1 sq deg), or where the MeanObject objects are missing (~341 sq deg). For the stack objects, the object entries are missing in ObjectThin, but they are present in StackObjectThin (and other stack tables). For the missing mean objects, the problem is that there are entries in ObjectThin but the corresponding magnitude information is missing from MeanObject. The effective result is that the objects do not show up in searches if any magnitudes or other properties are required (which is the usual case.)
...
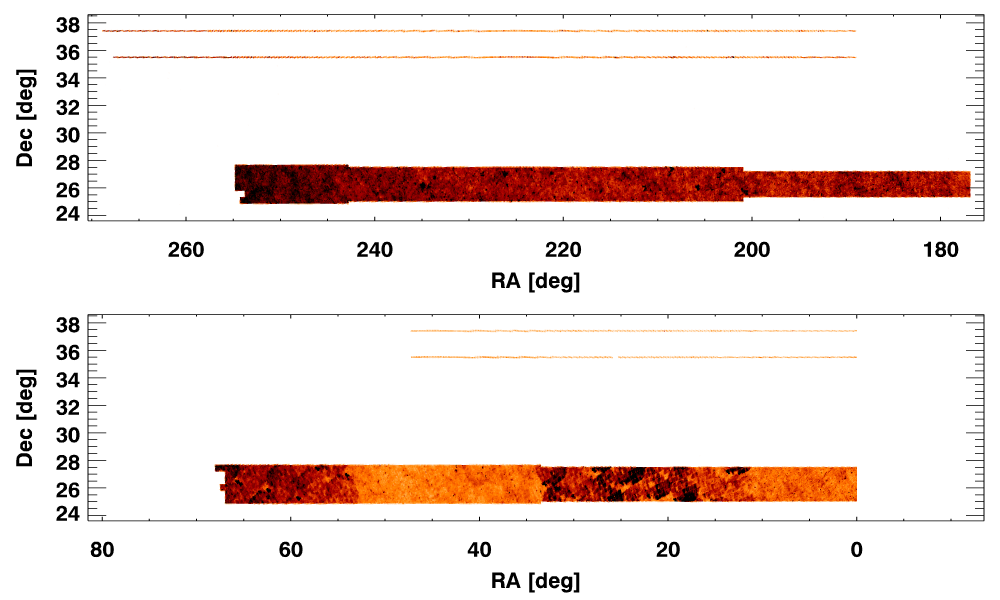
Figure showing details of missing declination strips. The top narrow strip is from missing stack objects,
while the other two are missing MeanObject entries. Note that the wide strip varies in declination width.
Astrometry differences between stack and mean positions
The astrometry for the mean object positions in PS1 (the raMean and decMean columns in the ObjectThin table) were updated shortly before the PS1 DR1 release using Gaia as a reference catalog. The previous version of the astrometry used 2MASS as a reference catalog. That version had systematic absolute errors of up to ~0.1 arcsec depending on the location in the sky. The new Gaia-based astrometry is much more accurate, with median errors of only about 5 milliarcsec. See the PS1 Astrometry page for more details.
...
The bottom line is that users should take care with the astrometry of objects that are not detected in the mean filter magnitudes. We expect this to be fixed in the DR2 release.
Astrometric and photometric differences between images and catalogs
The astrometric world coordinate system keywords in the FITS image headers were derived at the time the image pixels were processed. The catalogs have had significant post-image processing to improve both the astrometric and photometric calibrations of the catalog objects. The Gaia DR1 catalog, which was released well after the pixel processing was complete, was used to improve the astrometric calibration of the catalog object positions. The ubercal procedure was used to modify the photometric calibration using sources observed in multiple images. That allowed correcting small errors in the photometry that depended on the exposure conditions, the epoch of the observation, the position in the detector, etc.
...
We may at some future point update the astrometry in the images to correct for larger shifts between the Gaia-based coordinates and the older 2MASS-based coordinates. Accurate corrections of the smaller scale astrometric and photometric variations from the catalog-phase processing would require reprocessing the images. That is not being contemplated at this time.
Questionable Images near the Pole
A cross-registration problem exists for small areas near the North Pole. Affected regions have internal registration errors of potentially as much as several pixels, and quantitative measurements of the source properties, such as PSF magnitudes, are likely in error. These regions have been flagged in the main DR2 object and detection tables, and source magnitudes have been set to invalid (-999). The image quality for stacked images is visibly worse than for the majority of DR2 data. However, stacked images may still be suitable for non-critical applications, therefore images are available in the DR2 release. Users retrieving these images should see a warning linking to this page, and are cautioned 1) to inspect the images carefully for problems (disappearing or excessively faint sources, misshapen sources, point sources appearing to be extended, misregistration across filters), and 2) to avoid making quantitative measurements from the stacked images. The individual warps are expected to have nominal image quality, except for their astrometry.
...
The affected regions are identified by their skycell names in this Table of bad skycells. The Table includes a quantitative measure of the misregistration issue, in the form of the fraction of objects (minimum 5 detections) with an internal positional scatter larger than 1.5 pixels. The bad regions are also identified in the Plot of bad skycells near the North Pole.
Astrometry issues near the pole
Some exposures near the pole suffer from incorrect astrometry, with errors up to 1". As a result the stacking process has been affected, resulting, in the worse cases, in double images. The WCS content of the FITS headers in both warp and stack images may therefore be incorrect. Most of the problems lie above a Declination of +85 degrees.
...
Our intention is to produce corrected images and new, separate, polar region catalogues for DR2.
FITS image format quirks
The FITS images have several unusual characteristics. They are described in more detail in the image cutout documentation. We may fix this at some time in the future, but since we have 2 petabytes of PS1 FITS images, this is unlikely to be done soon.
...