The Frontier Fields (FF) are selected to be among the strongest lensing clusters on the sky. In order to interpret many of the properties of background lensed galaxies, reliable models of the lensing maps for each cluster are required. Preliminary models for each of the six Frontier Fields clusters have been provided by five independent groups prior to the HST Frontier Fields observing campaign in order to facilitate rapid analysis of the FF data by all members of the community. These models are based upon a common set of input data, including pre-FF archival HST imaging and a common set of lensed galaxies.
To access the public FF lensing models, please see: Frontier Fields Lensing Models
For additional information on gravitational lenses, please see: Frontier Fields Lensing Primer
Hubble Frontier Fields Lens Model Methodologies

The various groups model the cluster mass distribution in different ways. Together, they explore a broad range of possible lens models, all of which reproduce the lensing observables well. We cannot yet say which models are more accurate. An exercise is underway to directly compare model methodologies using simulations of lensing clusters.
The primary distinction between models is that some assume luminous cluster galaxies trace the cluster mass substructure, while others do not. This assumption has been shown to improve strong lens model accuracies and predictive powers relative to modeling clusters as single mass profiles. It is also a useful prior to constrain cluster substructure. Magnification estimates are sensitive to local mass perturbations. However, deviations from the light-traces-mass model parameterizations are likely to occur in nature. These deviations include scatter in galaxy mass-to-light ratios, dark matter stripped and spread asymmetrically within cluster halos, and mass structures along the line of sight behind or in front of the cluster. Dropping the assumption of light traces mass open up a much broader range of possible lens models. Thus, this approach is complementary to assuming light traces mass.
Here we briefly describe the model methodologies used by each group. More detailed descriptions are available in the README files provided by the groups. The CATS and Sharon groups both use Lenstool, a widely used, publicly available strong lens modeling software. The cluster mass is modeled as two components: 1) individual galaxies, as identified spectroscopically or photometrically from the existing HST images, with masses scaling with luminosity; and 2) one or more larger cluster halo components. Each mass component has a parameterized profile such as isothermal or NFW.
Zitrin-NFW is a similar parameterization implemented independently by Adi Zitrin. Zitrin-LTM is a different parameterization in which again the cluster is modeled as two components, but the cluster component is derived by smoothing and scaling the galaxy component. Thus the cluster light traces all of the mass in the Zitrin-LTM models. Both Lenstool and Zitrin-LTM have been used to identify many multiple images of galaxies strongly lensed by clusters.
The three other groups (Williams, Bradac-Hoag, Merten) make no assumptions about light tracing mass. Their models are constrained solely by the lensing observables and thus probe a broader range of possible mass distributions. Williams uses the GRALE modeling software which is based on a genetic algorithm for searching the model space. Bradac and Merten both incorporate weak lensing shape measurements in addition to the strongly lensed multiply-imaged galaxies used by the other groups. The Merten model has lower resolution but extends to much larger radius, including the Frontier Fields parallel observations.
All models cover the cluster core where strongly lensed arcs provide the best constraints. This area corresponds to most of the HST/ACS field of view to be imaged by the Frontier Fields. The areas covered by each model are detailed below. Also shown are the magnification maps from all models for lensed galaxies at z = 9.
model   |   center RA & Dec (J2000)  | width (sq) or area | resolution        | pixels on a side
CATS      00:14:20.312  -30:23:18.10    5.340' x  6.088'    0.2001" x 0.2283"    1600
Sharon    00:14:21.199  -30:23:50.08    3.369'              0.03"                6736
Zitrin    00:14:21.726  -30:24:03.36    3.000'              0.06"                3000
Williams  00:14:21.229  -30:23:48.39    2.329'              0.2794"               500
Bradac    00:14:19.511  -30:23:45.90    3.502'              0.0513"              4096
Merten    00:14:20.666  -30:24:00.86   25.053' x 25.026'    8.333"                180


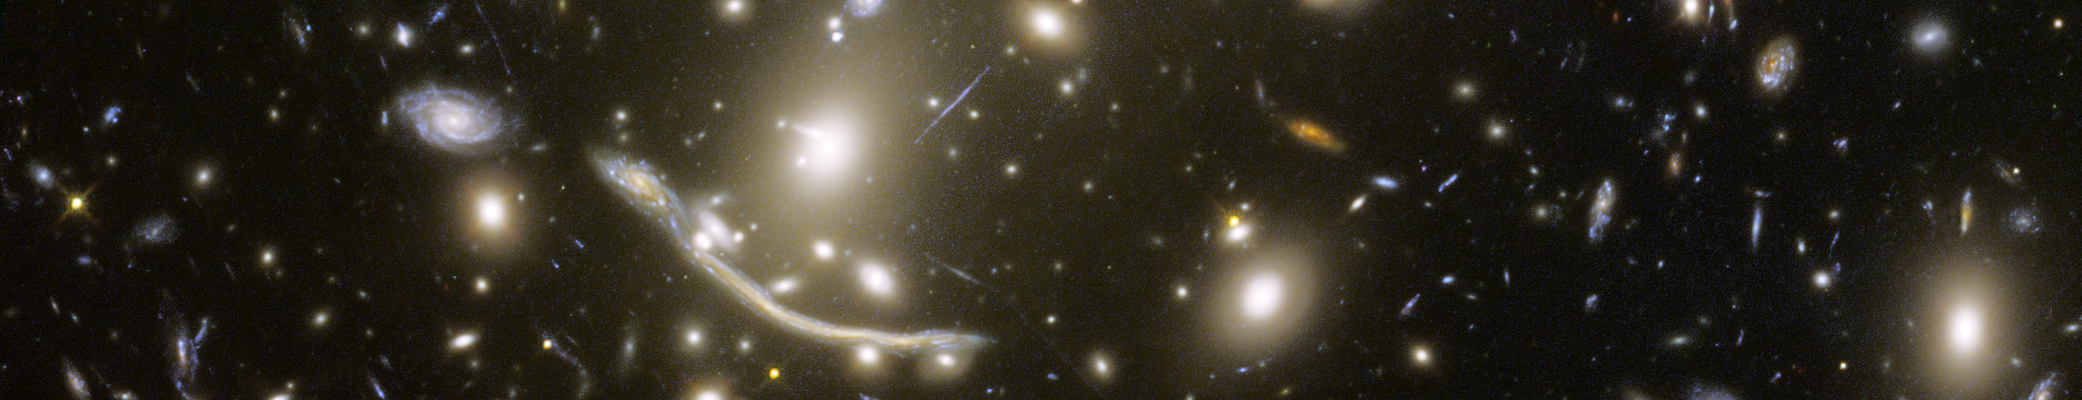
Above: Coverage of the various lens models (regions file) overlaid on a color image of the pre-FF HST mosaic images using Trilogy. Also shown are the FF HST FOVs (regions file) in blue (ACS) and red (WFC3/IR).
This webpage was written with input from the lens modelers.