Page History
| Excerpt | ||
|---|---|---|
| ||
Basic description and navigation of the returned search results |
| Panel | ||||||
|---|---|---|---|---|---|---|
| ||||||
On this page...
|
After performing a search, the results display in a new Portal tab. The results tab consist of a main toolbar followed by a table of results from which you can perform various actions such as column / row toggling, column manipulation, loading data into visualization tools, and downloading data directly or in bulk using the download basket. This page describes how to navigate and interact with the table of search results.
| Anchor | ||||
|---|---|---|---|---|
|
Each result tab has a toolbar that provides a variety of information, and actions that can be performed, as shown in Fig. 1.
| Panel | ||||||||
|---|---|---|---|---|---|---|---|---|
| ||||||||
Figure 1 — The toolbar at the top of the Results Panel. The toolbar provides additional information, options, and functionality related to the search results, as described in the table below. |

| Note |
|---|
Not all options apply for a given search or result (row). One or more buttons will be greyed out in such cases. |
The toolbar provides the following items:
| Item | Name | Description |
|---|---|---|
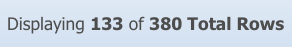
| Result Count | Number of rows that match the search query. |
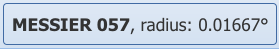
| Target button | Displays the canonical (resolved) target name and the search radius; expandable to show the target coordinates. |
| Permalink | Creates a persistent link (URL) to search results. Use this link to share search results with collaborators, or for your own reference. |
| Cross-Match | Cross-match the search results (or selected rows) against another catalog hosted at MAST (see Data Holdings for a list of catalogs). |
| Spectral Viewer | Display the spectrum, if the result is a spectral data product. |
| Chart Tool | Display x-y scatter plots of search result column values. |
| Column Manipulation | Perform column arithmetic, and remap position columns. |
| Download Basket | Add selected row objects to the basket for downloading. Individual rows may also be added to the basket from the Actions column pull-down menu. |
| Object Subscription | Subscribe to receive notifications about the availability or status of a program or observation. Note: only available for products originating from the HST and JWST missions. |
| Export Table 94964825 button | Export the search results (or a subset of them) to a local file, in one of a few common formats. |
| AstroView Controls | Controls for AstroView footprints |


Results Table
A search produces a set of results displayed by default in a list format, as shown in Fig. 2. See below for a description of the column fields. Each row corresponds to a single match to the search criteria: e.g., an observation if searching MAST missions, or individual sources if searching catalogs.
| Panel | ||||||||
|---|---|---|---|---|---|---|---|---|
| ||||||||
Figure 2 — A panel of search results, displayed as a list view. Click the tabs (top left) to toggle between a list view or an album view. |
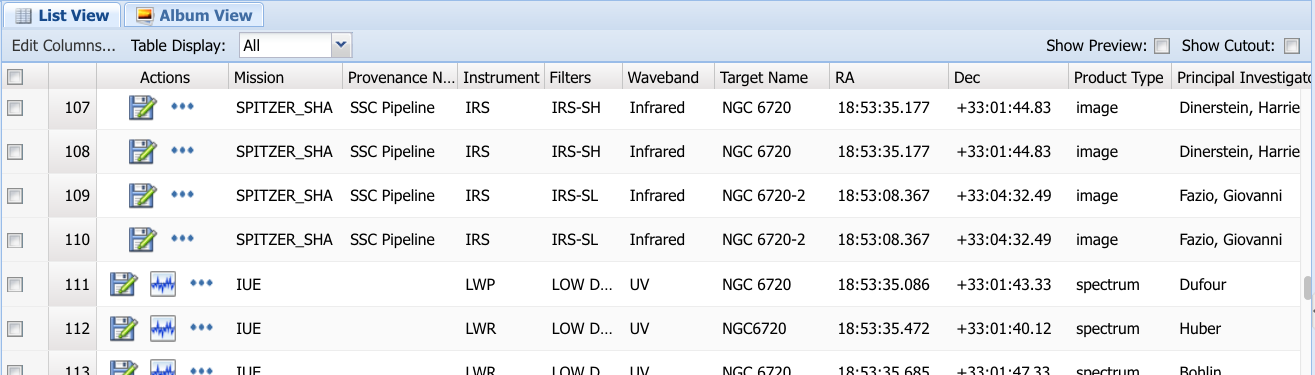
Table Column Fields and Descriptions
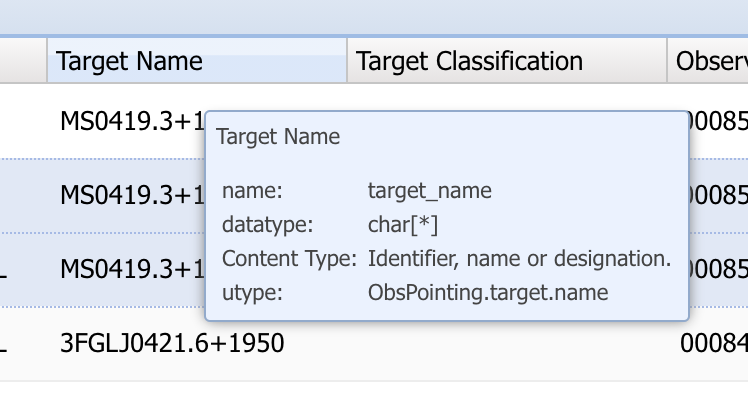
The Portal search results shows columns that are unified into a common nomenclature across missions. You can hover over each column name to see a pop-up with more information such as column description and column units, if any.
Click the link below to show the available columns and their descriptions:
| Expand | ||||||||||||||||||||||||||||||||||||||||||||||||||||||||||||||||||||||||||||||||||||||||||||||||
|---|---|---|---|---|---|---|---|---|---|---|---|---|---|---|---|---|---|---|---|---|---|---|---|---|---|---|---|---|---|---|---|---|---|---|---|---|---|---|---|---|---|---|---|---|---|---|---|---|---|---|---|---|---|---|---|---|---|---|---|---|---|---|---|---|---|---|---|---|---|---|---|---|---|---|---|---|---|---|---|---|---|---|---|---|---|---|---|---|---|---|---|---|---|---|---|---|
|
Changing the Columns Displayed
Hover on the checkbox column to show a dropdown menu containing a "Columns" entry. Click to select which columns to display/hide. Alternatively use the "Edit Columns" dropdown menu to display/hide specific columns. Column order may be changed by click-dragging a column to a new position.
| Multimedia | ||||
|---|---|---|---|---|
|
Changing the Rows Displayed
Select the rows with the checkboxes on the left and use the "Table Display" dropdown to display only the selected or unselected rows.
| Multimedia | ||||
|---|---|---|---|---|
|
| Anchor | ||||
|---|---|---|---|---|
|
The "Actions" column indicates other actions that can be performed for the given observation. The available actions depend upon the type of results in the row, but in general are:
| Icon | Name | Description |
|---|---|---|
| Download Data Products | Directly download the data products associated with this observation |
| Time-series Viewer | View a time-series in the time-series visualization tool |
| Spectral Viewer | View a spectrum in the spectral visualization tool |
| Load Catalog Data | Load any catalog data for this observation in new tabs |
| Toggle Overlay Image | Toggle an overlay of the associated image in AstroView |
| More Actions | A list of other available actions: see below |
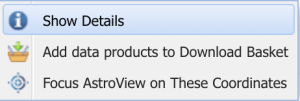
The following figure shows more actions that can be performed:
- Display detailed information about the observation,
- Add the data products for the observation to the download basket,
- Focus the AstroView tool on the coordinates of the observation.
| Anchor | ||||
|---|---|---|---|---|
|

The "Create Columns" tool allows the user to perform arithmetic operations on one or two columns at a time. Operations such as addition, subtraction, multiplication and division are supported for two columns, or one column with a user-specified constant. Logarithms and exponentiation are also available for single columns.
| Multimedia | ||||
|---|---|---|---|---|
|
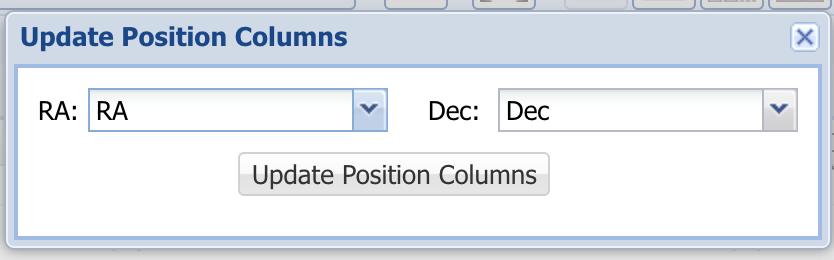
Remap Position Columns 
For some result tables, e.g. when performing a cross-match or when adding offsets to the original RA/Dec, there may be some ambiguity as to which columns should be used as the primary position columns. Clicking the Choose Position button allows you to specify the columns to use for the RA/Dec.
| Anchor | ||||
|---|---|---|---|---|
|

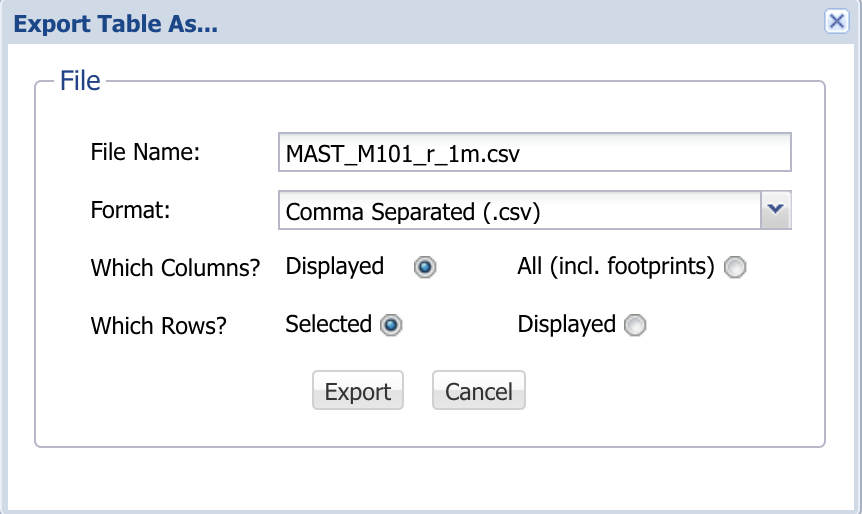
To export the table of search results, click the "Export Table" button. This brings up a new pop-up window with options for exporting. The available file formats are csv, xml, json, html. The default filename will be the name displayed in the results tab, i.e. collection + filter condition, or you can set your own file name for the table. You can also select which columns and rows to include in the exported table.