Users of the current PS1 DR2 data should be aware of a few issues and inconsistencies in the data.
Missing data
The current version of the database is missing data over about 0.016% of the survey (4.9 square degrees). The missing regions lie in areas where no sources were ingested into the ObjectThin table (only ~1.5 sq deg). Note that an earlier issue where the MeanObject objects were missing (over a much larger area) has been fixed.
The figures below show where data are missing. The first figure shows a schematic plot with the locations of missing data. The other two plots show closeups with more detail. The most noticeable missing areas are long narrow strips in declination. The approximate boundaries of the missing data are given in the table below.
Note that the DR2 version of the catalog also has a sharp cut (almost everywhere) at a declination limit of -30 degrees. DR1 did include some objects south of the nominal survey limit. The quality of data and sky coverage south of -30 deg are very uneven. Users who need access to the extreme southern data can still use the DR1 database. We may add these sources to the DR2 database in some form in the future, but the majority of science projects should utilize the current version of the database that stops at -30 deg.
The declination cut was not applied in a narrow RA strip between 214 and 216 degrees. In that region the catalog extends down to declination -36 deg. There some tables where additional information can be found on objects south of -30 deg (e.g., the Detection table). This data is unlikely to be of good quality due to uneven sky coverage. For most purposes data south of -30 deg should be ignored.
| Boundaries of regions with missing data | |||
|---|---|---|---|
| min(Dec) [deg] | max(Dec) [deg] | min(RA) [deg] | max(RA) [deg] |
| 35.46 | 35.499 | 189.0 | 267.7 |
| 35.46 | 35.499 | 0.0 | 25.31 |
| 35.46 | 35.499 | 25.88 | 47.25 |
| 76.88 | 78.11 | 123.34 | 126.66 |
| 75.47 | 76.40 | 342.51 | 345.00 |
| 73.60 | 74.06 | 343.50 | 345.00 |
| -27.18 | -26.72 | 76.40 | 76.91 |
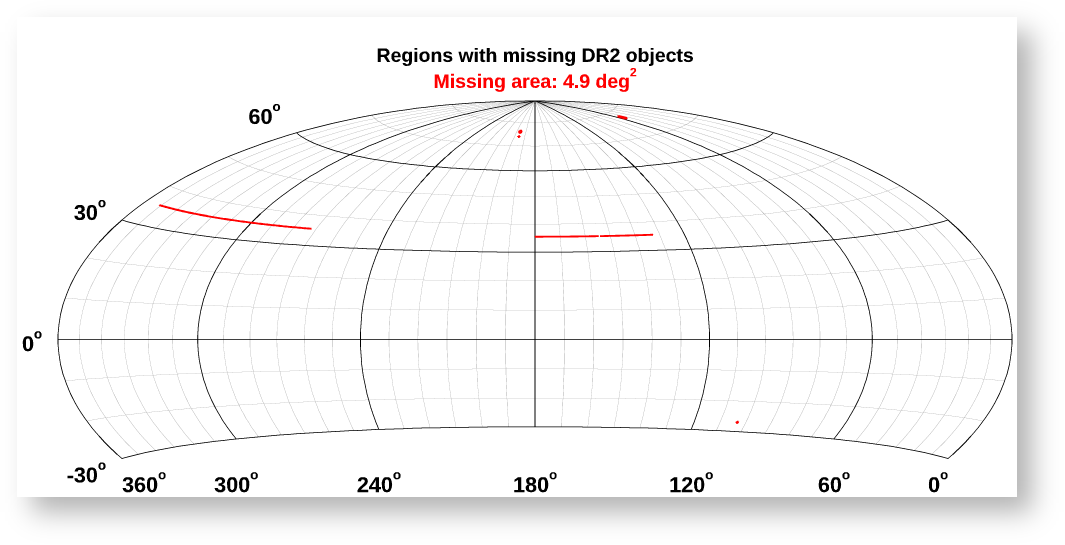
Figure showing regions where objects are missing.
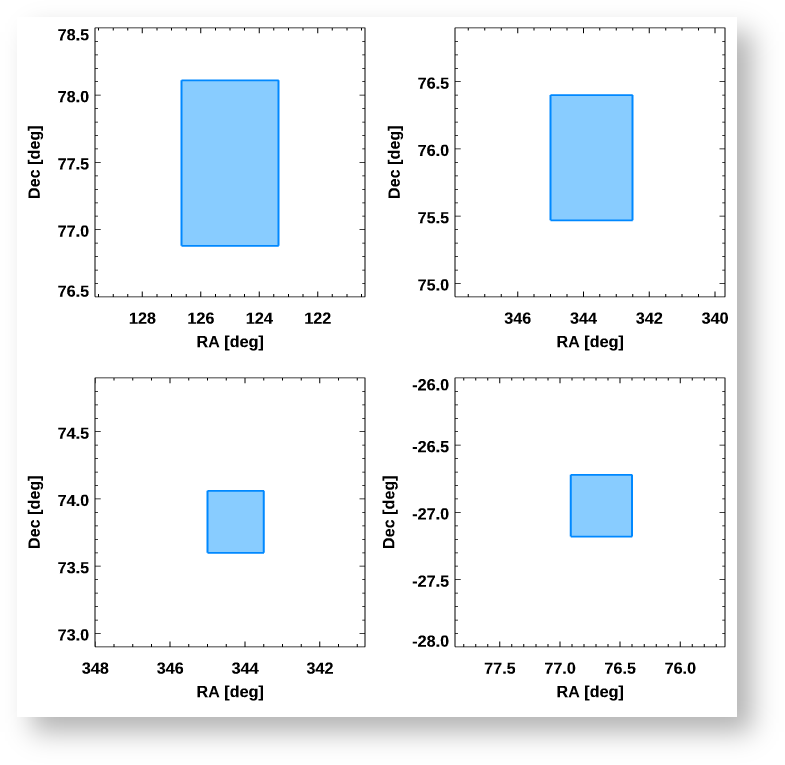
Figure showing closeups of small holes with missing objects.
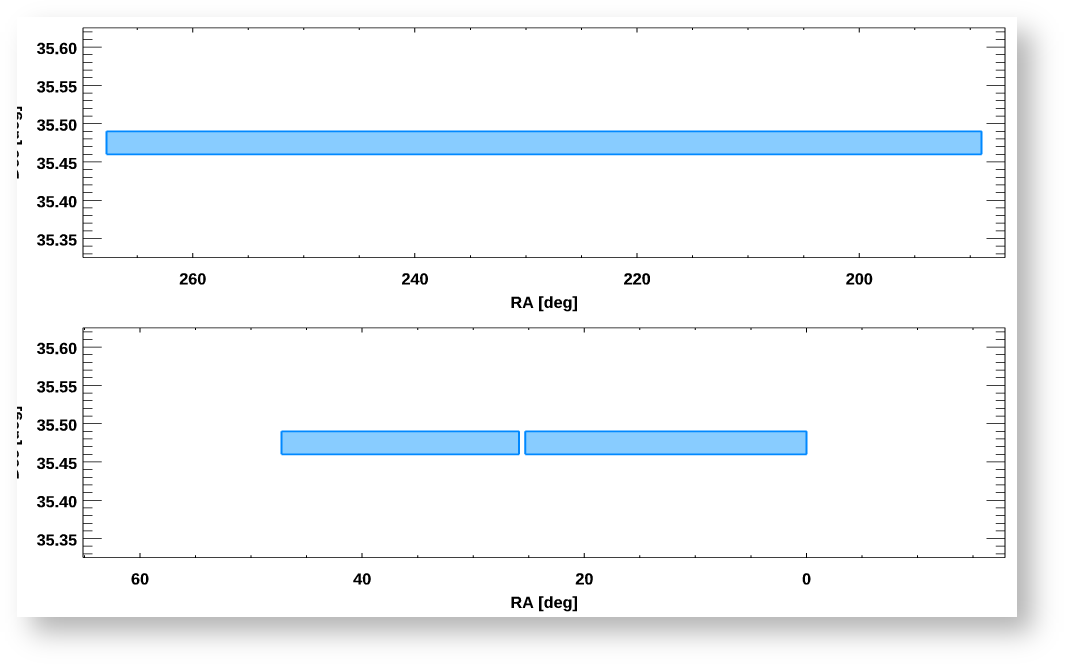
Figure showing details of missing declination strips. Note the strips are narrow, so the y-scale is much different than the x-scale.
Astrometry differences between stack and mean positions
The astrometry for the mean object positions in PS1 (the raMean and decMean columns in the ObjectThin table) were updated shortly before the PS1 DR1 release using Gaia as a reference catalog. The previous version of the astrometry used 2MASS as a reference catalog. That version had systematic absolute errors of up to ~0.1 arcsec depending on the location in the sky. The new Gaia-based astrometry is much more accurate, with median errors of only about 5 milliarcsec. See the PS1 Astrometry page for more details.
However, the astrometry in this update was only applied to objects that are detected in the single-epoch warp images. Objects too faint to be detected in single epoch images are detected only in the deeper stack images. The RA and Dec measurements for stack objects have not been placed on the Gaia frame and so have larger systematic errors than mean measurements.
Stack-only objects are within ~1.3 mag of the 5σ detection limit of the survey and so tend to have noisier position measurements. That means that the position for an object is not greatly degraded by the systematic error. But if the positions of multiple faint stack objects are averaged (e.g., by using a set of stack objects as an astrometric reference), the systematic errors in the astrometry may become noticeable.
The bottom line is that users should take care with the astrometry of objects that are not detected in the mean filter magnitudes. We expect this to be fixed in the DR2 release.
Astrometric and photometric differences between images and catalogs
The astrometric world coordinate system keywords in the FITS image headers were derived at the time the image pixels were processed. The catalogs have had significant post-image processing to improve both the astrometric and photometric calibrations of the catalog objects. The Gaia DR1 catalog, which was released well after the pixel processing was complete, was used to improve the astrometric calibration of the catalog object positions. The ubercal procedure was used to modify the photometric calibration using sources observed in multiple images. That allowed correcting small errors in the photometry that depended on the exposure conditions, the epoch of the observation, the position in the detector, etc.
Since both of these calibrations were completed after the creation of the images, the image FITS headers do not reflect the improvements. Measurements made directly from the images will consequently not be as accurate either photometrically or astrometrically as measurements in the catalog.
We may at some future point update the astrometry in the images to correct for larger shifts between the Gaia-based coordinates and the older 2MASS-based coordinates. Accurate corrections of the smaller scale astrometric and photometric variations from the catalog-phase processing would require reprocessing the images. That is not being contemplated at this time.
Questionable Images near the Pole
A cross-registration problem exists for small areas near the North Pole. Affected regions have internal registration errors of potentially as much as several pixels, and quantitative measurements of the source properties, such as PSF magnitudes, are likely in error. These regions have been flagged in the main DR2 object and detection tables, and source magnitudes have been set to invalid (-999). The image quality for stacked images is visibly worse than for the majority of DR2 data. However, stacked images may still be suitable for non-critical applications, therefore images are available in the DR2 release. Users retrieving these images should see a warning linking to this page, and are cautioned 1) to inspect the images carefully for problems (disappearing or excessively faint sources, misshapen sources, point sources appearing to be extended, misregistration across filters), and 2) to avoid making quantitative measurements from the stacked images. The individual warps are expected to have nominal image quality, except for their astrometry.
Our intent is to reprocess these regions and obtain improved stacks and source measurements, to be made available as part of DR2.1.
The affected regions are identified by their skycell names in this Table of bad skycells. The Table includes a quantitative measure of the misregistration issue, in the form of the fraction of objects (minimum 5 detections) with an internal positional scatter larger than 1.5 pixels. The bad regions are also identified in the Plot of bad skycells near the North Pole.
Astrometry issues near the pole
Some exposures near the pole suffer from incorrect astrometry, with errors up to 1". As a result the stacking process has been affected, resulting, in the worse cases, in double images. The WCS content of the FITS headers in both warp and stack images may therefore be incorrect. Most of the problems lie above a Declination of +85 degrees.
The warp catalogue positions (and therefore ramean and decmean) are not affected, as these have been re-calibrated to Gaia (except possibly for the slice indicated in the figure below), However, the stack catalogue positions (rastack, decstack, and the individual stack positions for each band) may be in error, and may differ between bands.
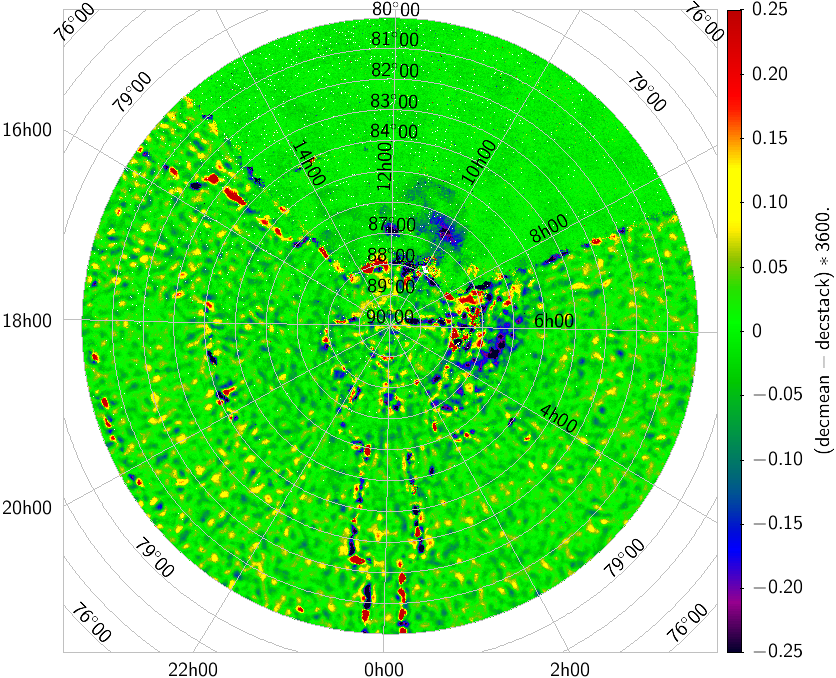
This image indicates the extent of the problem. It shows the median difference between decmean and decstack values in DR1 above 80 deg Declination (for objects with 16<ipsf<20). The colour range spans offsets of +/-0.25". Areas coloured blue or red should be treated with caution. The general mottling effect at the +/-0.1" level is due to the Gaia recalibration of the warp (but not stack) catalogue positions. The smooth, wedge-shaped section between 7h and 15h is believed to be a region where the Gaia recalibration of the warps did not make its way into DR1. It extends down to +75 deg. This will be corrected in DR2. |
|---|
Our intention is to produce corrected images and new, separate, polar region catalogues for DR2.
FITS image format quirks
The FITS images have several unusual characteristics. They are described in more detail in the image cutout documentation. We may fix this at some time in the future, but since we have 2 petabytes of PS1 FITS images, this is unlikely to be done soon.
The images are compressed using the FITS tile-compressed image convention. The format can be read by most FITS libraries or can be converted back to a standard uncompressed FITS image using the fpack utility. Note that this applies only to the full skycell FITS images – FITS cutout images are not compressed.
One quirk of these images is that they use the obsolete WCS keywords PC001001, PC001002, PC002001, PC002002 instead of the FITS standard keywords CD1_1, CD1_2, etc. Many software packages automatically handle the old PC keywords, but some require special processing (e.g., in IDL you should call the fits_cd_fix procedure to modify the header). If you do not use these keywords, you will find that the RA pixel spacing has the wrong sign (it is positive instead of negative).
Another issue with the image astrometry is that the full skycell FITS images do not have a RADESYS keyword. That leads some software to incorrectly interpret the coordinates as being equinox 1950 rather than equinox 2000. At the moment the only known software with this issue is DS9 v8, but it could happen with other software as well. The fix is to insert the keyword RADESYS = 'FK5' in the header. FITS cutout images have a correct RADESYS keyword (as of 2019 March 13), but full skycell FITS images do not.
The image pixel values have been non-linearly scaled using an arc hyperbolic sine (asinh) transformation that converts them to a pseudo-magnitude scale related to the asinh magnitudes (aka "luptitudes") that are used in the Sloan Digital Sky Survey. The scaling is determined by the BSOFTEN/BOFFSET keywords in the FITS header. Here are the relevant lines from the header of the skycell 1725.051 g-band image:
BZERO   =   3.283630371094E+00 / Scaling: TRUE = BZERO + BSCALE * DISK
BSCALE  =   2.008622776974E-04 / Scaling: TRUE = BZERO + BSCALE * DISK
BSOFTEN =   8.739592975627E+01 / Scaling: LINEAR = 2 * BSOFTEN * sinh(TRUE/a)
BOFFSET =   2.654963016510E+00 / Scaling: UNCOMP = BOFFSET + LINEAR
The BZERO and BSCALE keywords are the standard FITS keywords for converting an integer image to a floating point value. If v is the original float pixel value (after applying BZERO/BSCALE to the integer value), these equations convert v to a standard linear flux:
x = v * 0.4 * ln(10) = v / 1.0857362
flux = boffset + bsoften * 2 * sinh(x)
     = boffset + bsoften * (exp(x) - exp(-x))
     = boffset + bsoften * (10**(0.4*v) - 10**(-0.4*v))
The 3 equations for the flux are equivalent. The third equation shows the connection of the values to asinh magnitudes.
The asinh flux scaling also applies only to the full skycell FITS images – FITS cutout images are converted to standard linear fluxes.