This page describes the Jdaviz interface as it appears in a web browser.
On this page...
Elements of the Jdaviz Graphic Interface
The main display for Jdaviz spectroscopic quicklook and analysis is shown in Figure 1. This page helps you easily look at spectroscopic datasets and perform quick analysis, using the Jdaviz Python package. Currently, you can only load in one spectral file at a time. In the top menu bar, the Docs button links to the Jdaviz Python documentation, and the API button links to relevant API documentation describing a variety of programmatic endpoints the user can use.
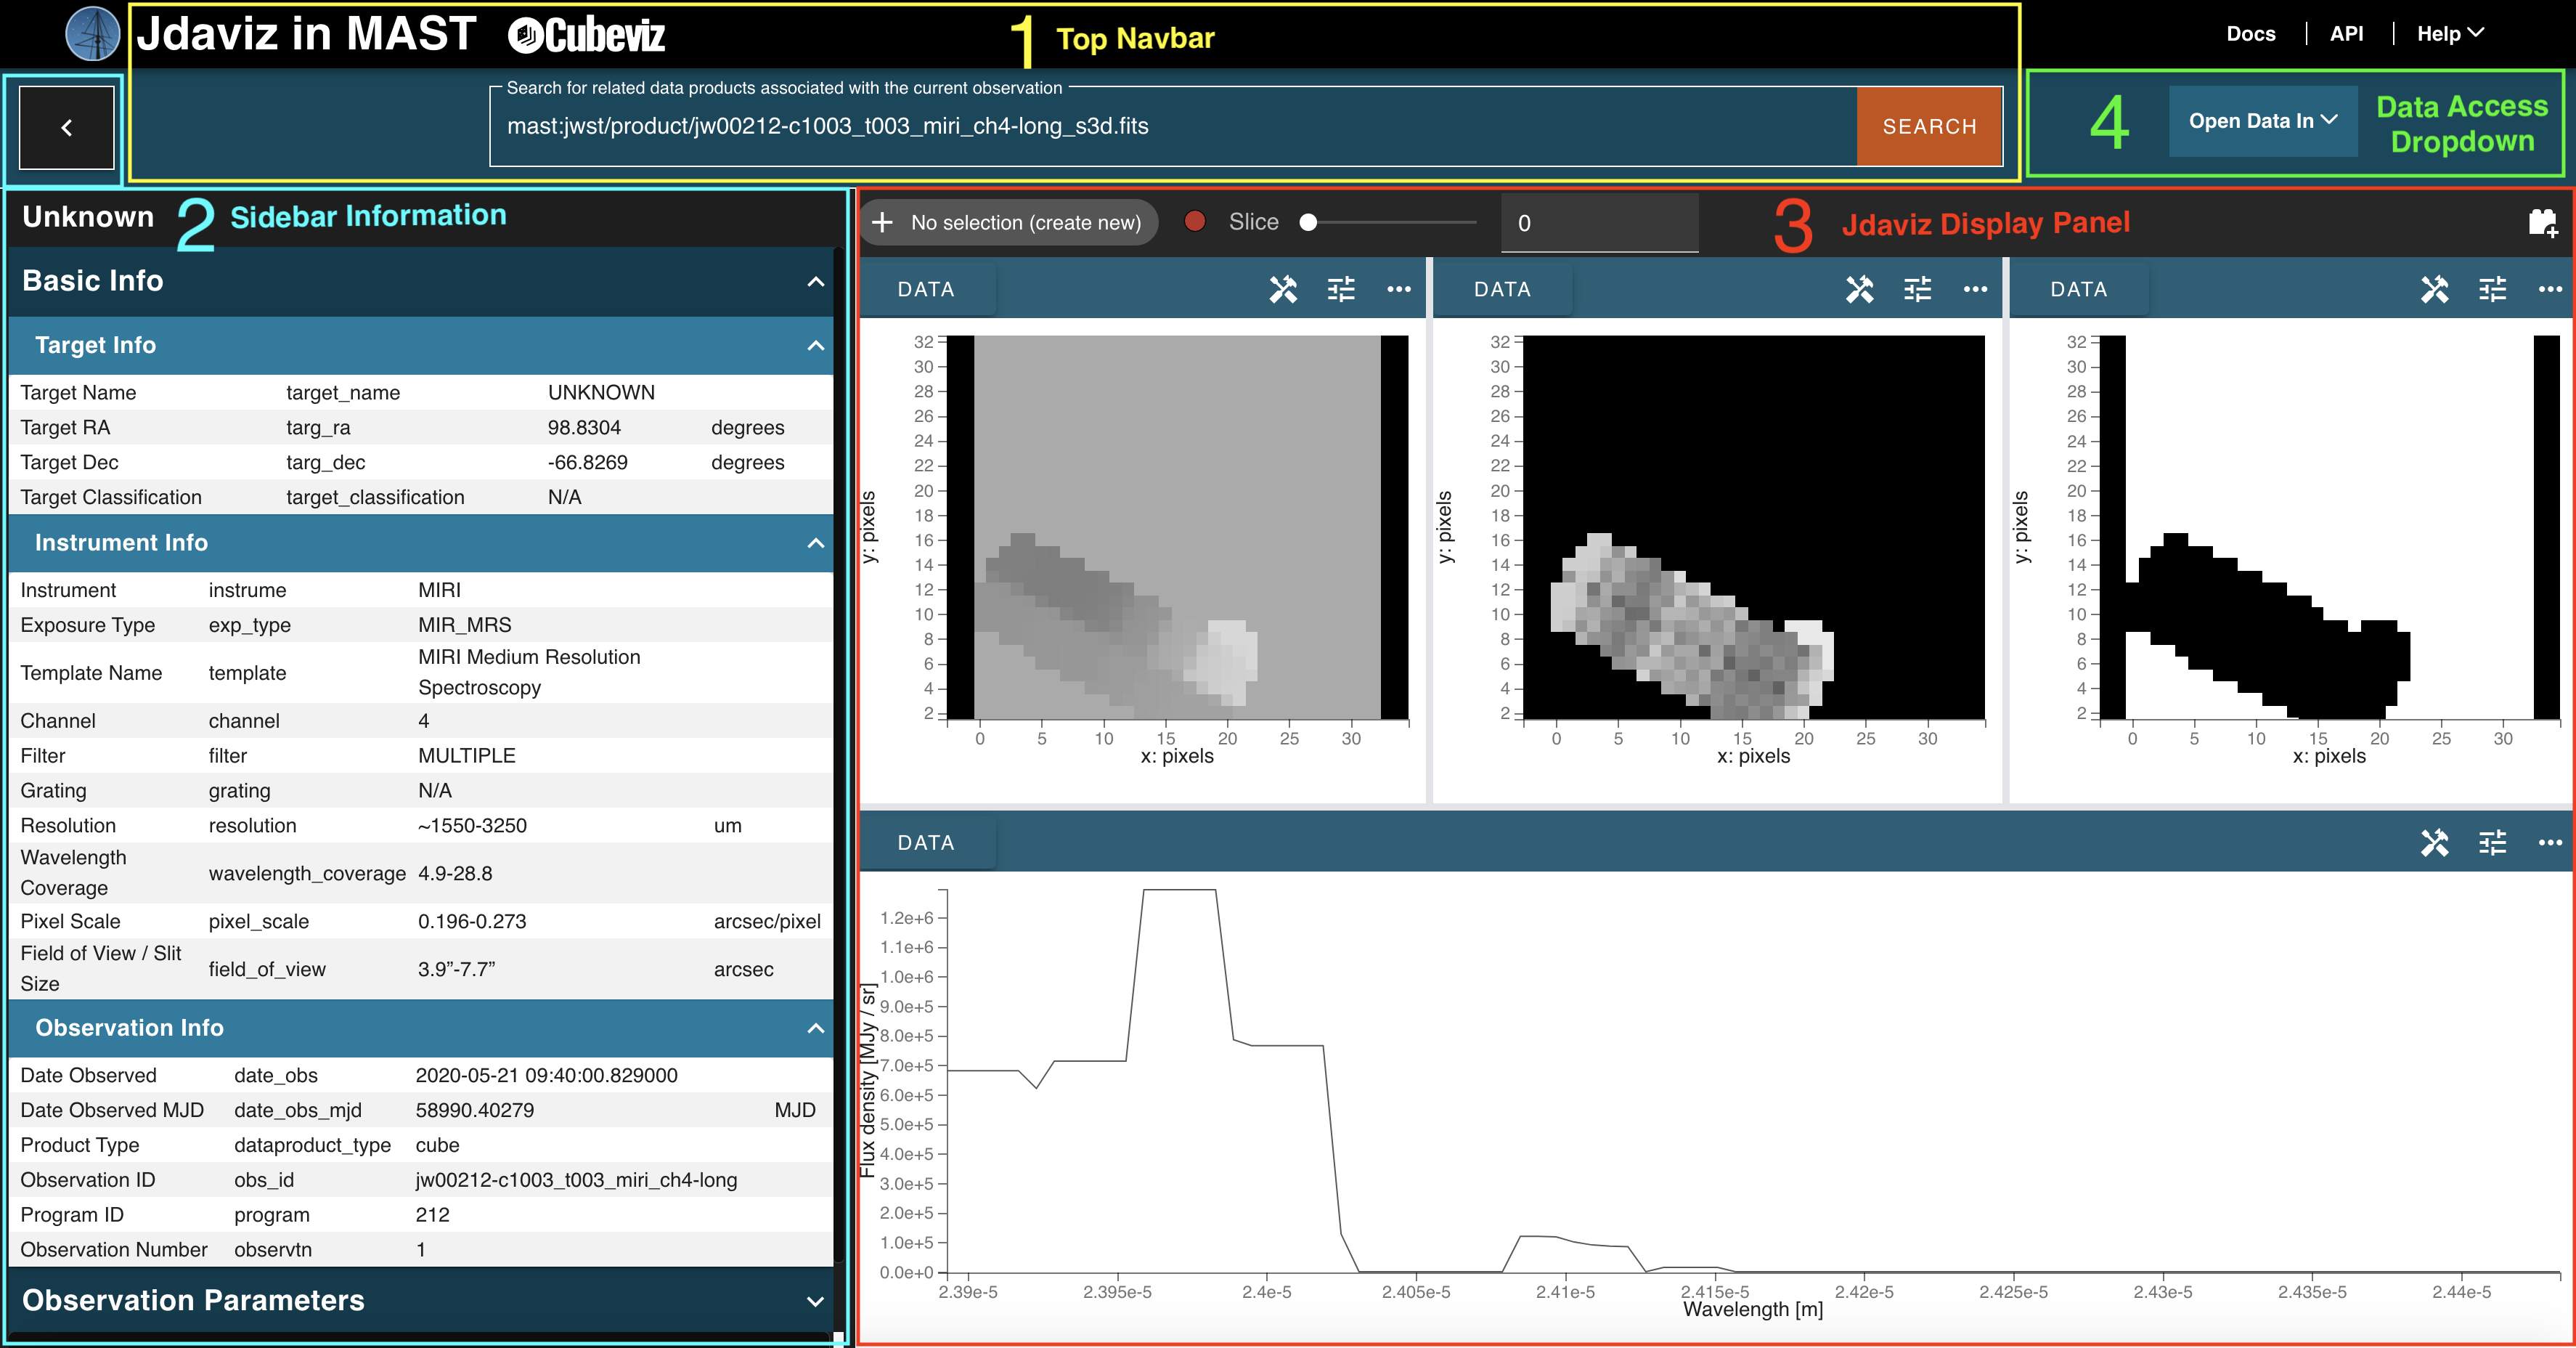
Figure 1 — The primary page for Jdaviz Spectroscopic Quicklook in MAST, consisting of four main sections: The Navigation Bar (1: top), Sidebar Information Panel (2: left), Jdaviz application display panel (3: center right), and Data Access Dropdown Menu (4: top right).
Navigation Bar
The data product URI is in the top navigation bar (see Figure 2). You can input either the full URI, or just the filename, and click "Search" to navigate to the desired file.

Figure 2 — The Navigation Bar. Used to identify the current file, and search for others.
Sidebar Information Panel
A panel is displayed on the left-hand side of the page consisting of three collapsible groups of information and parameters related to the currently viewed data product (Figure 3).
- Basic Info - Basic information about the target, the instrument that collected the data, and how the data is stored.
- Observation Parameters - Metadata parameters that are specific to the observation, such as: the principal investigator, proposal ID, and proposal title.
- Instrument Keywords - Science instrument (SI) keywords from the data product FITS header.
Each panel contains a list of parameters, with relevant ones sub-grouped into descriptive categories. Each parameter row displays a human-readable name, a database or API parameter name, the value of the parameter for the displayed target, and the unit, if any, of the parameter.
|
|
|
|---|
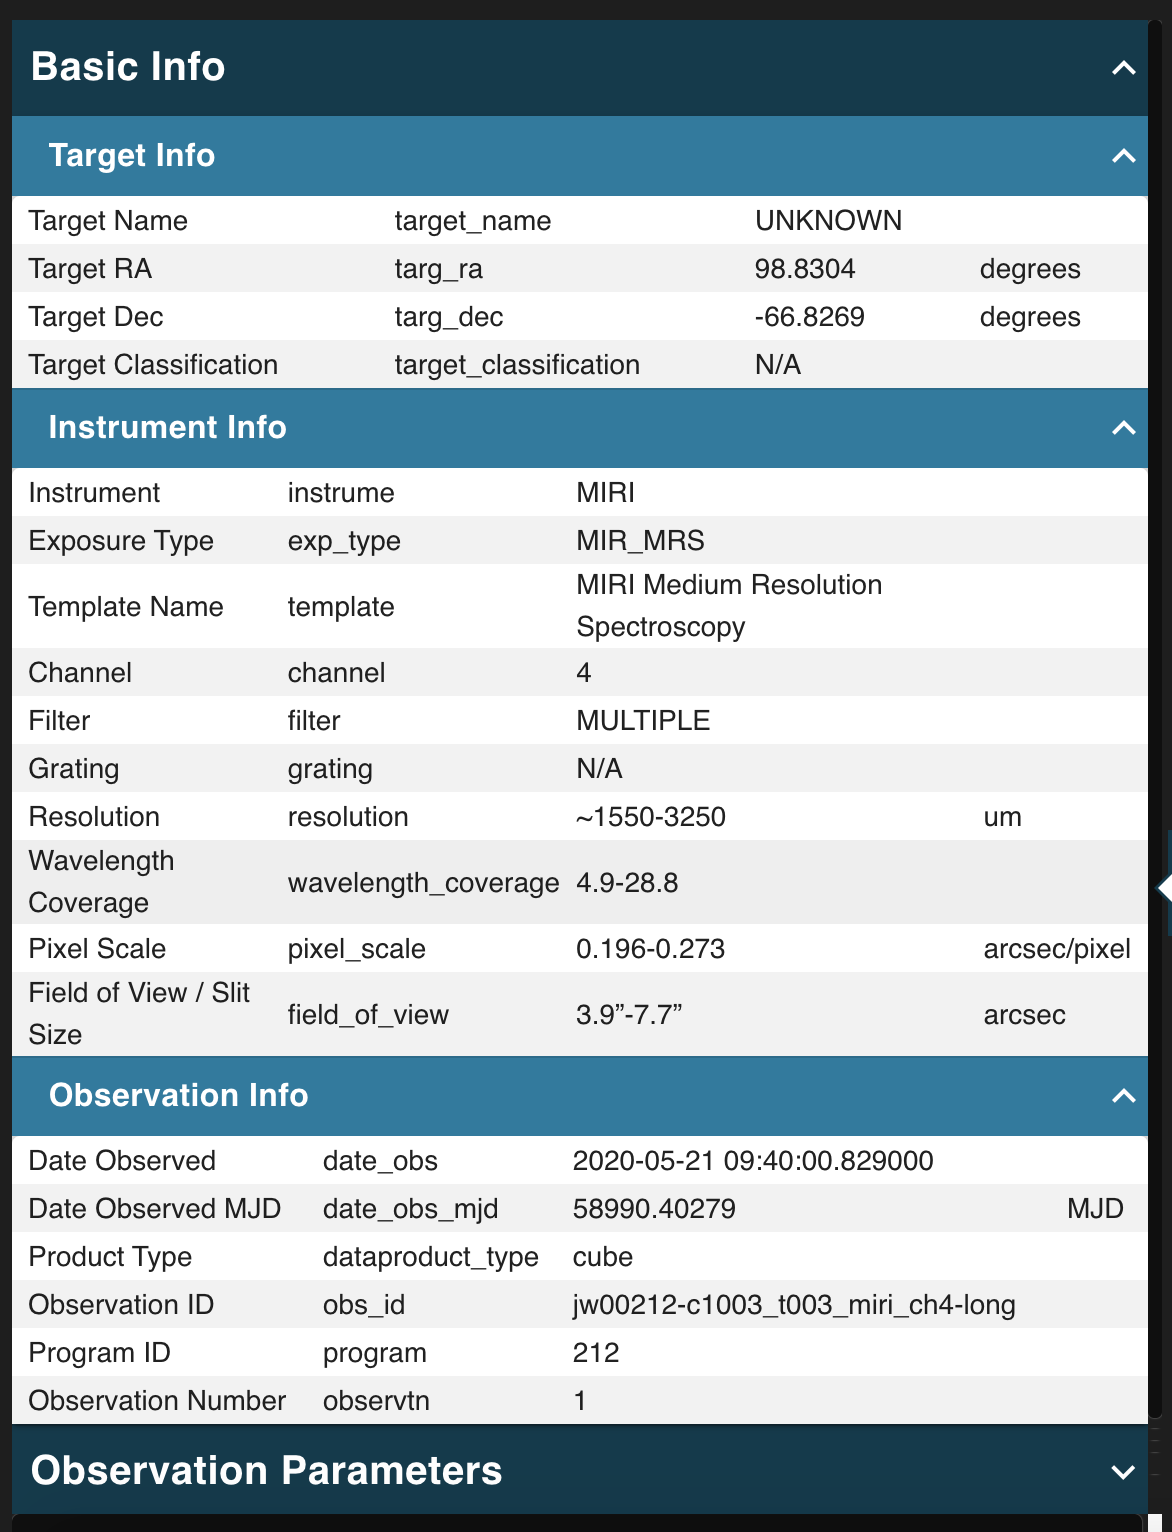
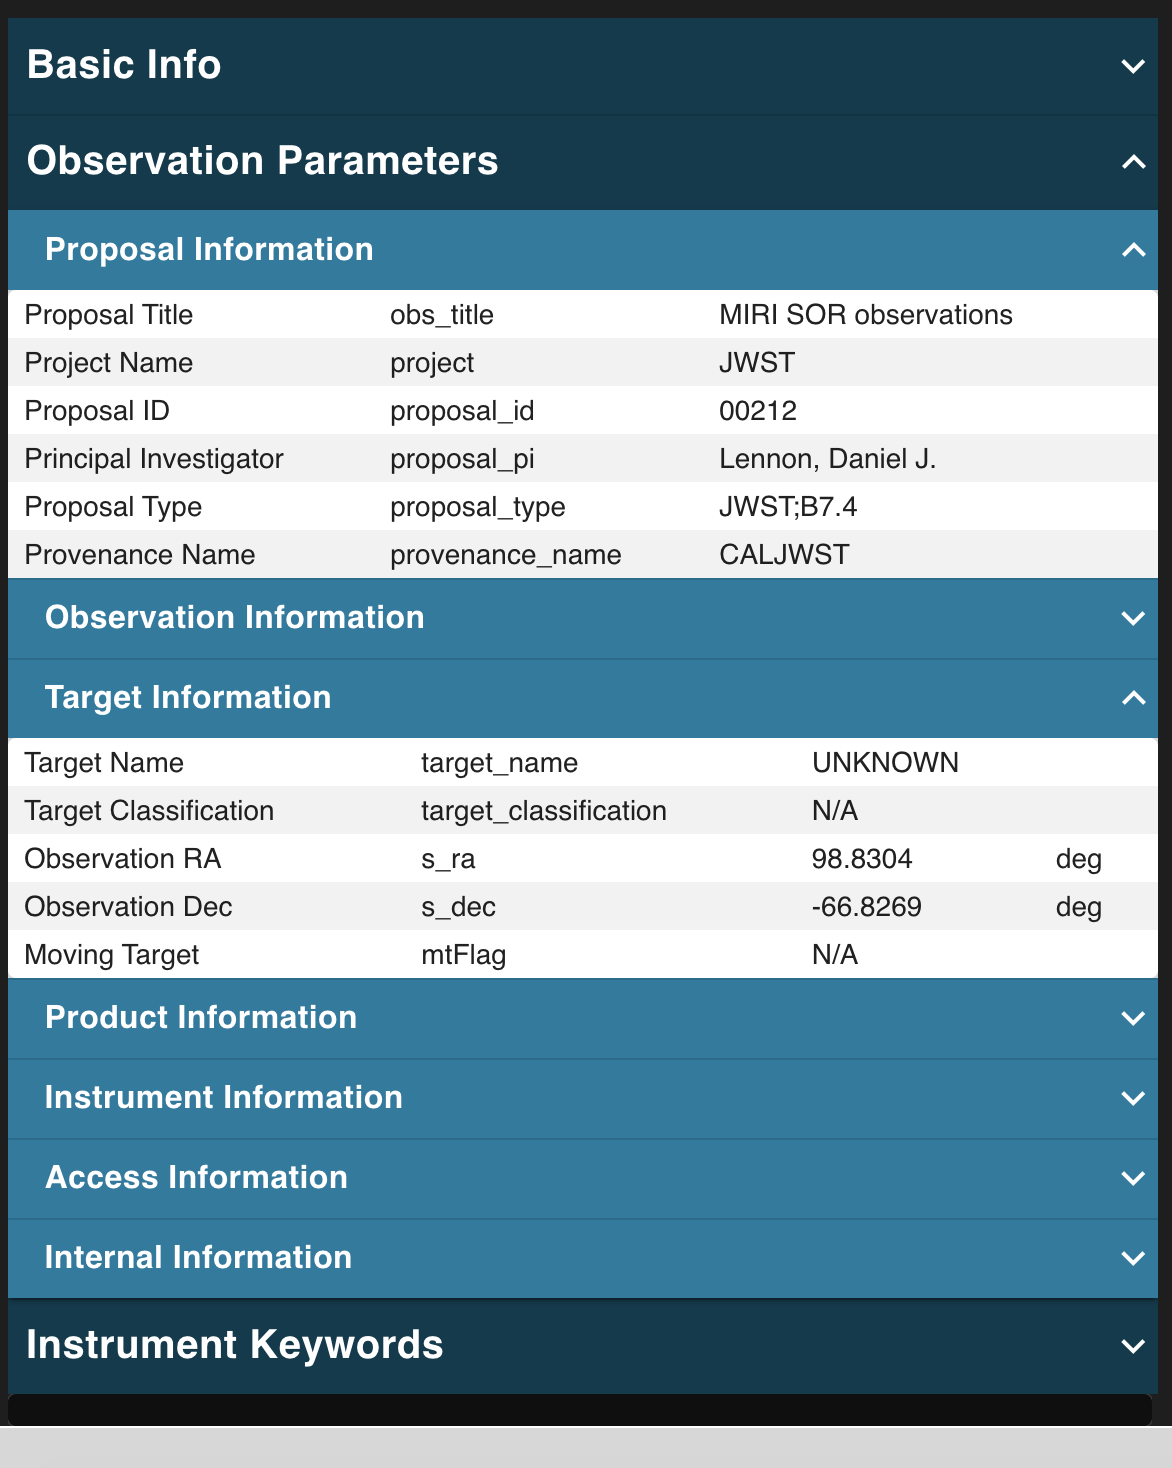
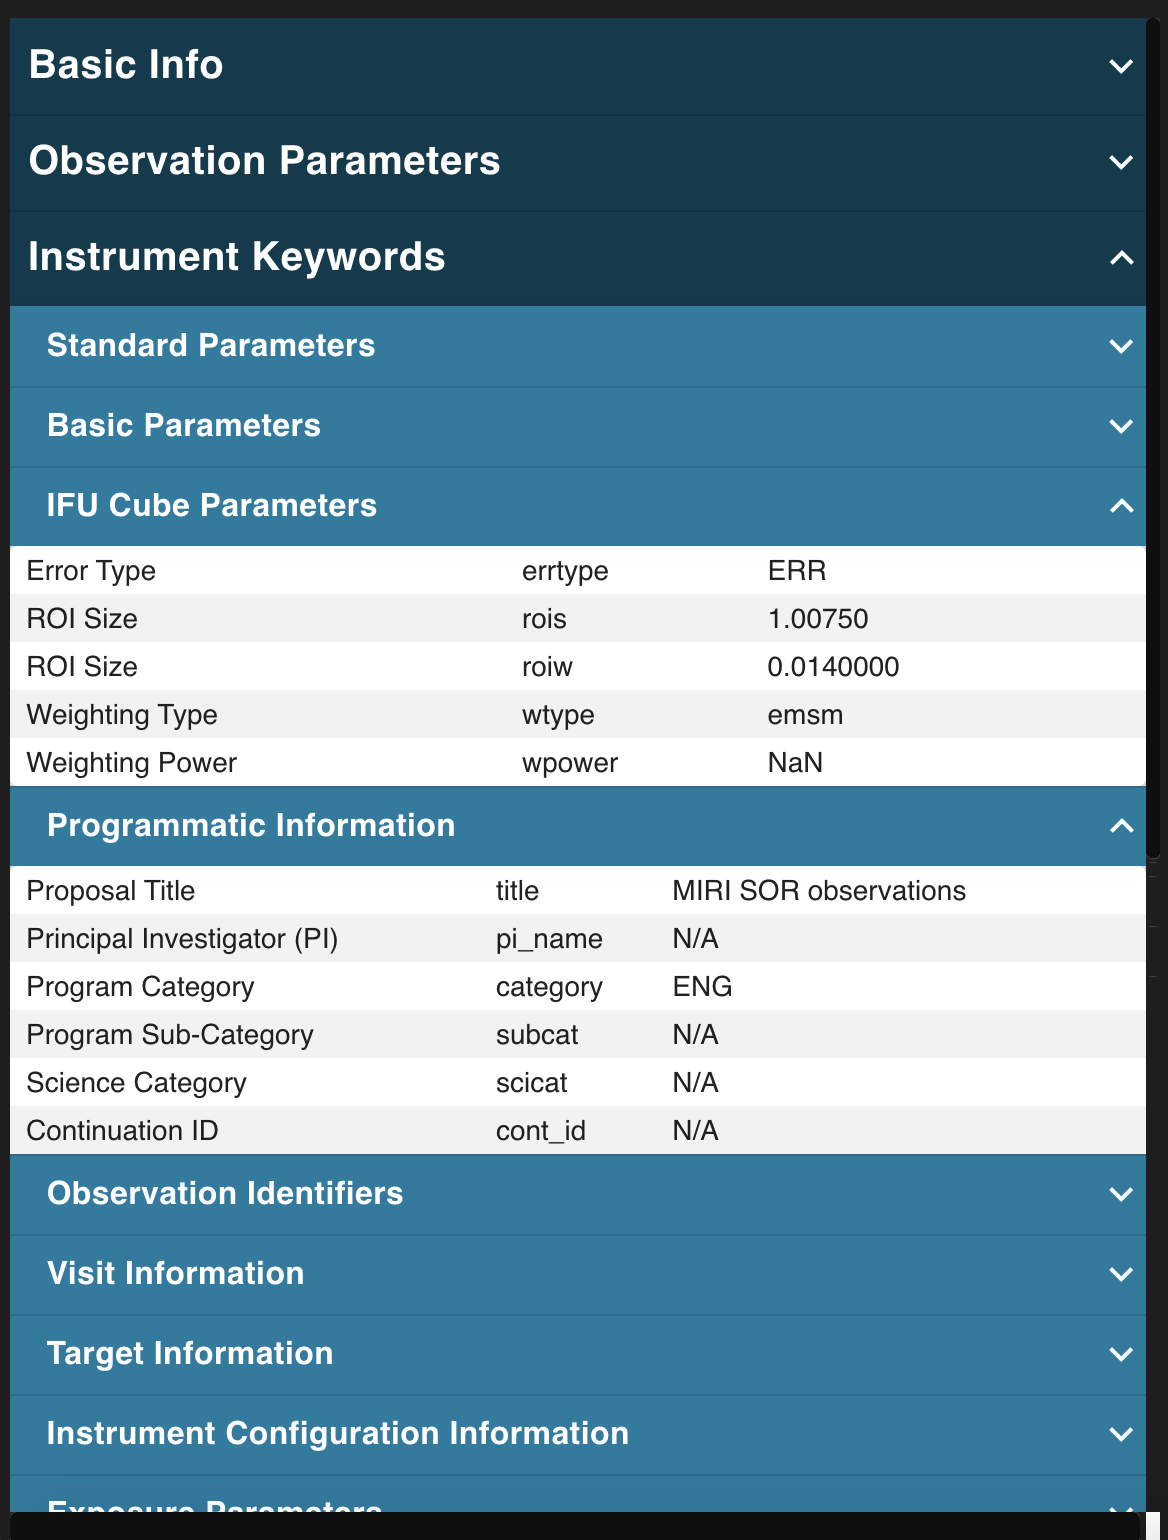
Figure 3 — Sidebar Information Panel. Left: Basic information about the target of observation. Middle: Parameters related to the observation that produced the data product. Right: Science Instrument (SI) keywords related to the data product, from the FITS headers.
Hovering over each section, sub-category or parameter item produces a tool-tip with a description of the displayed content (Figure 4).
|
|
|---|
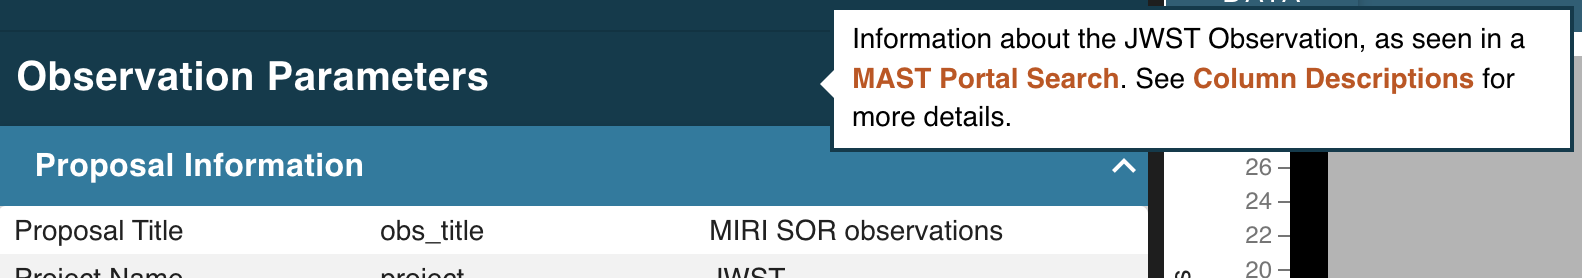
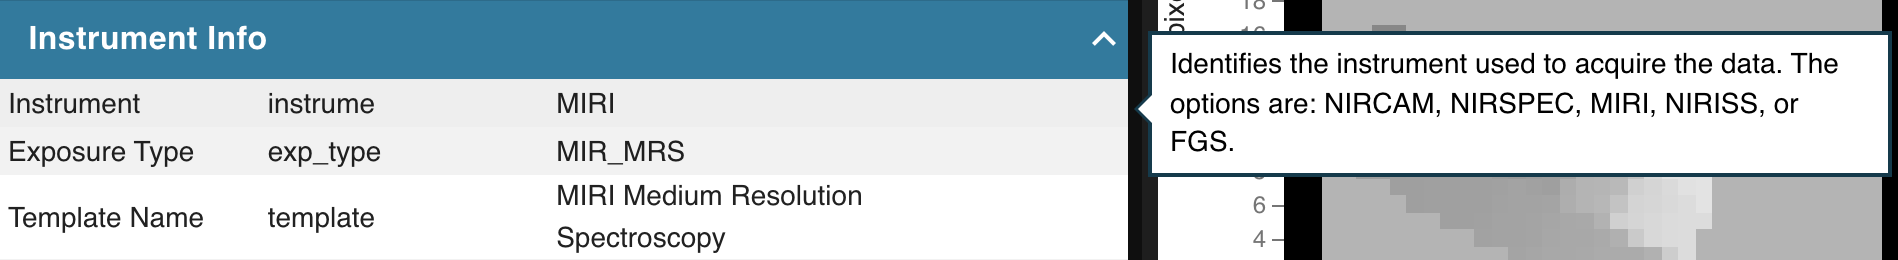
Figure 4 — Sidebar Information Panel. Hovering over section, group or parameter names displays descriptions for the given content.
If you want to collapse the sidebar panel and expand the Jdaviz content window to fill the screen, click the ![]() icon at immediately above the sidebar panel. Clicking again will re-expand the sidebar panel.
icon at immediately above the sidebar panel. Clicking again will re-expand the sidebar panel.
Jdaviz Application Display Panel
This is the main window for interacting with the data. Exactly what is visible depends on the type of data being visualized; for more information on all of the features available, please see Viewing Spectra and Images.
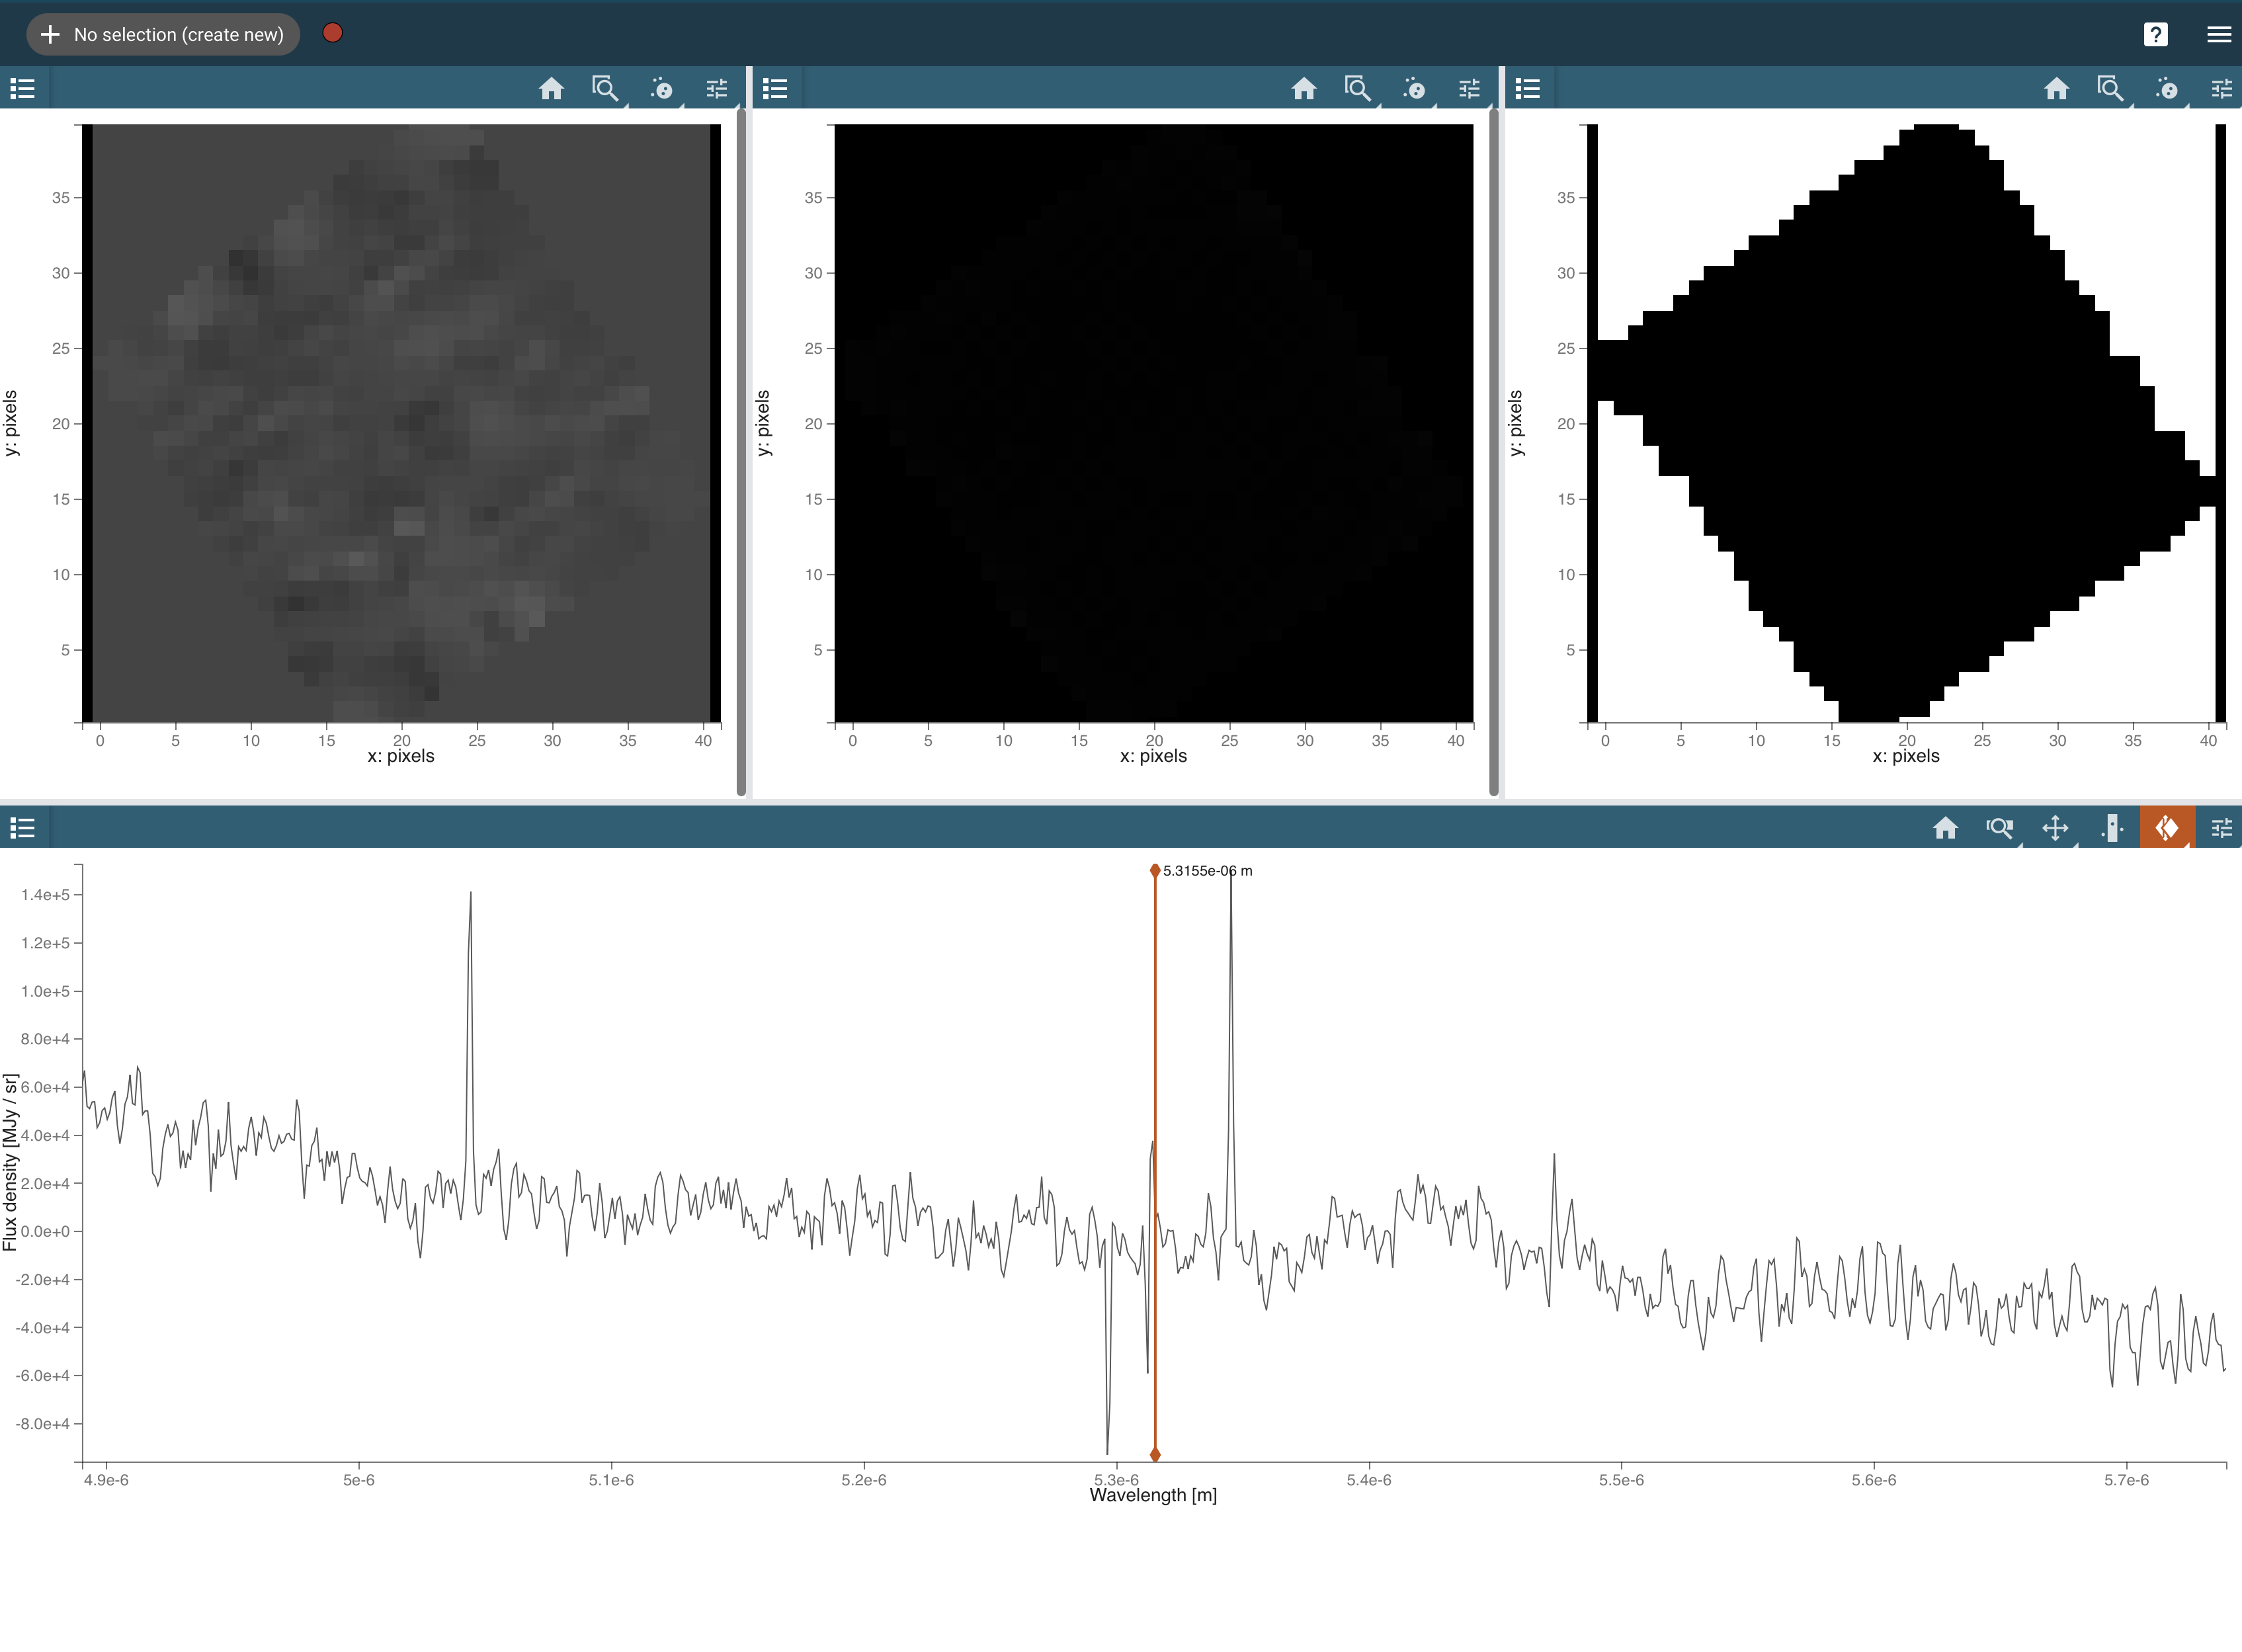
Figure 5 — An example set of JWST data. Depending on your data selection, you may not see the same analysis elements.
While viewing data in MAST Jdaviz, you can seamlessly transition to using Jdaviz within a Jupyter notebook in your local environment for deeper analysis. The dropdown menu offers one option: Jupyter (see Figure 6). More details about analyzing data in Jupyter, see Jdaviz at home: Jupyter Notebooks.
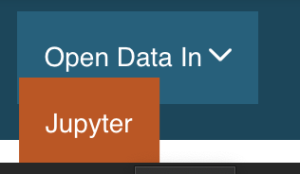
Figure 6 — Data Access Dropdown Menu showing the option to open your data in a local Jupyter Notebook.
For Further Reading...
- JWST Jdaviz Guided Examples: includes links to guided videos
- The Specviz Guide is a good starting point. It is the least complex option the software offers, and may help new users to get a 'feel' for the UI.