This article describes the effective area or grasp calibration phase of data processing. The FIMS team calculated a time-variable curve of effective area vs. wavelength for this step, while the SPEAR team used a grasp curve that was constant as a function of time.
On this page...
The FIMS team used a time-variable effective area curve to represent sensitivity vs. wavelength, while the SPEAR team used a time-invariant grasp curve, which is the product of the effective area and the field of view (FOV). The reason to use effective area vs. grasp in each case is discussed in Exposure Time Calculation.
FIMS procedure
L-band (IUE-based calibration)
To improve and confirm the accuracy of the effective area calibration for L-band, the FIMS team chose 28 bright stars observed by the International Ultraviolet Explorer (IUE) and recalculated the effective areas (Jo et al. 2016). These stars and their observation dates/orbits are listed in Table 1 of Jo et al. 2016. The stars were selected according to the following criteria:
- Single stars.
Average signal-to-noise ratio of the FIMS data ≥ 7.0.
B-type stars, which have nearly flat spectra without strong stellar absorption features. O-type stars were excluded because of the presence of strong absorption lines in the FUV wavelength. A-type stars were also excluded because of their weak fluxes at S-band.
The stars whose fluxes as observed by the IUE and the TD-1 mission are found to be consistent with 5%.
The effective area curve as a function of orbit number was modeled as a linear fit to the effective areas obtained from these IUE reference stars (which were observed at a variety of orbit numbers). This linear function, Aeff = a*orbit + b, where Aeff, a, and b are all functions of wavelength, is parameterized in a file available in Data Access.
S-band (HUT-based calibration)
Two O-type stars (Alpha Cam and HD 93521) were observed for the purpose of the calibration of the effective area of S-band, as shown in the table below. The effective areas were calculated by identifying emission lines, and dividing the integrated count rate (ct/s) under a line (integrating over wavelength) by the integrated Hopkins Ultraviolet Telescope (HUT) integrated flux under the same line. This procedure was necessary because SPEAR’s spectral resolution is higher than HUT's, and thus lines in the SPEAR spectra appear "taller" than HUT lines, which would result in an overestimate of the effective area if one were to simply divide the two spectra by each other. The data points were then fit with a 2nd-order polynomial. As shown in the figure below, the effective area decreased by a factor of about 3 between 2003 December and 2004 March. The FIMS/SPEAR S-band data products were obtained by linearly interpolating the two effective areas, estimated at two different time epochs. These two effective area curves are available by Direct Download, as files described in File Names and Content.
| Target | Orbit | Observation Date |
|---|---|---|
| Alpha Cam | 825 1059 1084 | 2003-11-22 2003-12-08 2003-12-10 |
| HD 93521 | 2332 | 2004-03-04 2004-03-04 2004-03-05 2004-03-05 2004-03-18 2004-03-19 2004-03-19 |
List of the reference stars used for the calibration of the S-band effective areas. Orbit refers to a running count of orbit number for the mission.
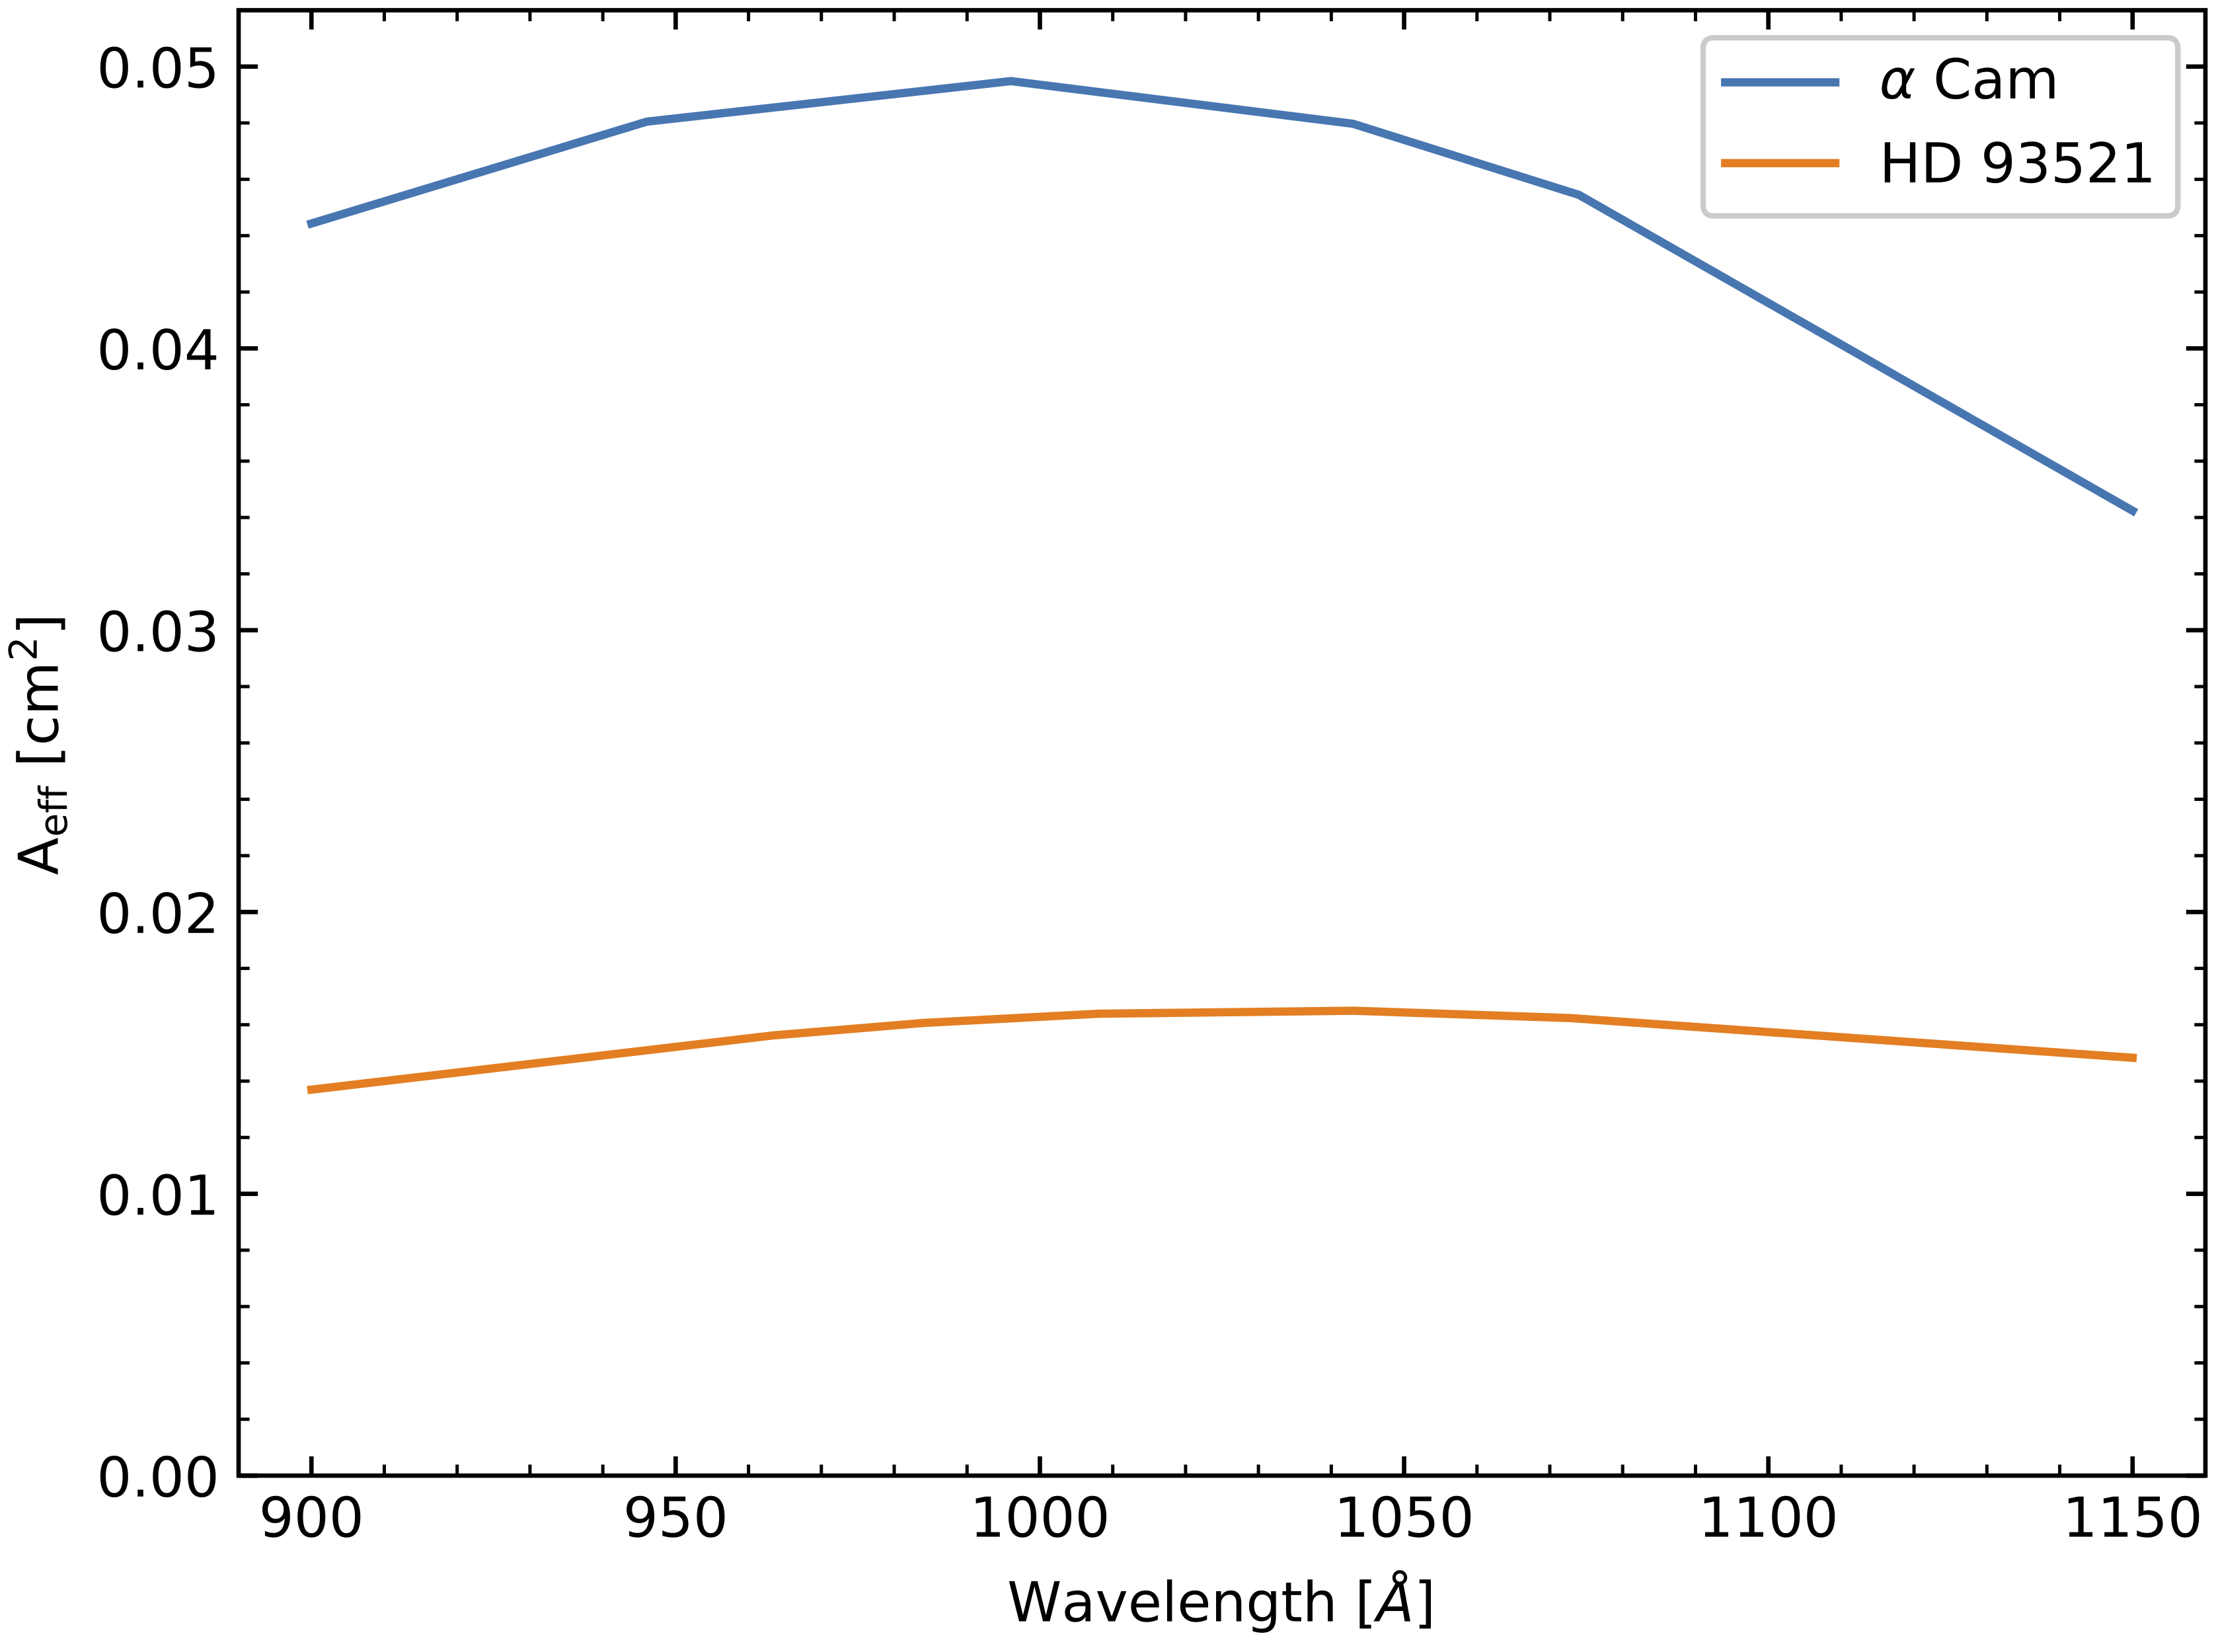
The effective area of the FIMS-SPEAR S-band in late-2003 (Alpha Cam) vs. March 2004 (HD 93521)
SPEAR procedure
The SPEAR team used a single effective area curve in each band. The calibrator targets used are not currently documented. To flux-calibrate photon flux in ct/cm2/sr-1/Å, they simply divided the photon/s spectrum in each HEALPixel by the grasp (effective area x FOV) curve. The grasp curve used did not vary as a function of HEALPixel. The grasp curves are available by Direct Download, as files described in File Names and Content.