Page History
| Warning | title | Under Construction|||
|---|---|---|---|---|
| Excerpt | ||||
This page is under construction. | ||||
| Excerpt | ||||
On this page, we'll review each component of the Mission Search user interface. The example we will use provides an overview on how to use the MAST Mission Search to find MAST data collections. The description of each form component on this page is based on theHST search form: by design, other data collections will use the .
|
| Panel | ||||||||
|---|---|---|---|---|---|---|---|---|
| ||||||||
On this page...
|
Major Components Of The Mission Search
FormTo guide discussion, it is helpful to define This chapter summarizes the field guide to the major components of the Mission Search form. There There are two three main areas: the front-page search form and , the search results table, and the download overlay. Each numbered box in these figures is described in a corresponding numbered subsection below.
Search Form
| Anchor | ||||
|---|---|---|---|---|
|
| Panel | ||||||||
|---|---|---|---|---|---|---|---|---|
| ||||||||
Figure 1 – The Search form window for Hubble, where numbered highlights correspond to areas where various search parameters and constraints are specified, and where searches are initiated. |
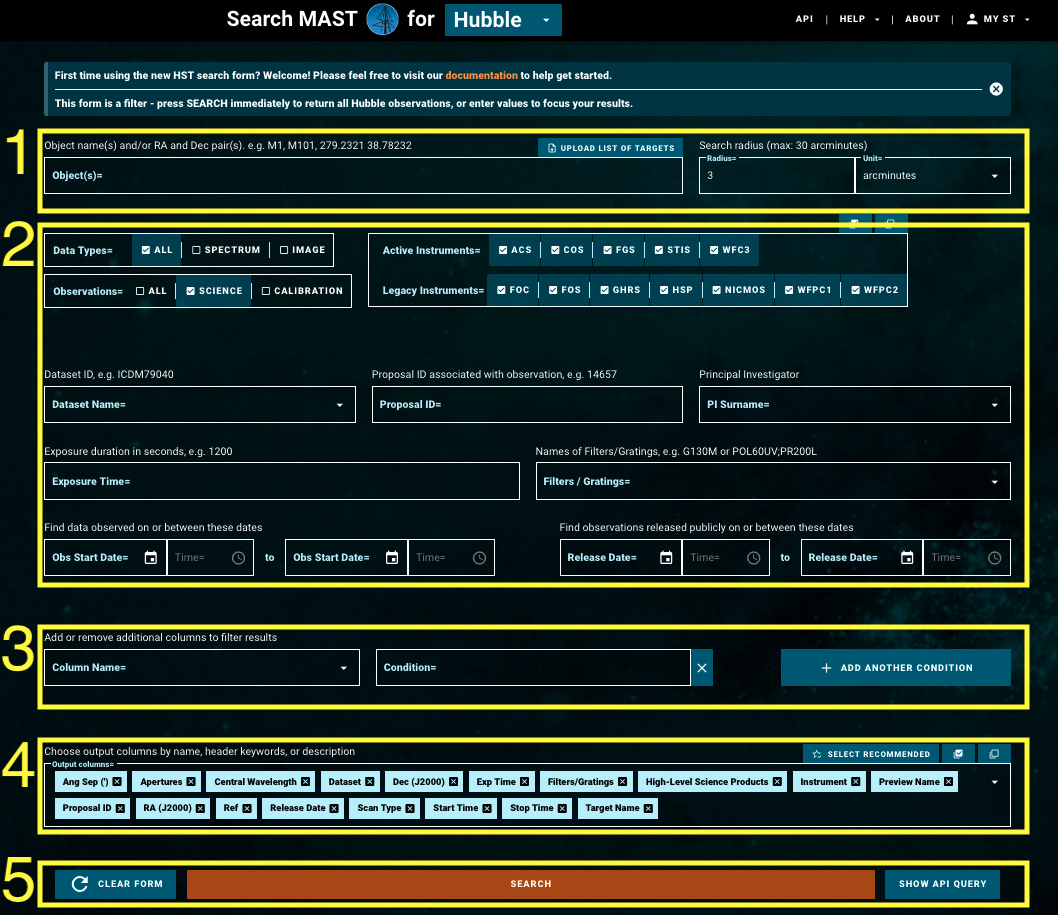
The search form is where users specify the search parameters and constraints to create their search. The available search options include:
Spatial cone search based on coordinates and/or object names,
- Direct search by dataset IDs,
- Advanced search with more specific constraints to narrow the search, and
- Search without specifying any filters. For example,
- Users can search for all observations taken with a particular instrument after a certain date without specifying a specific target.
- Or press 'SEARCH' without entering anything into the form to return every observation taken.
Each field in this search form provides a tooltip as a quick guidance. Users can hover over each field with their mouse to see the tips. Specific functionality of each component is summarized below.
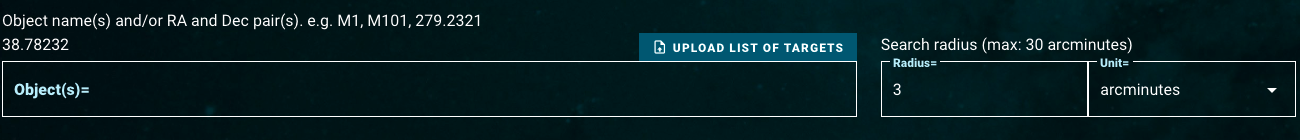
1. Cone Search and Upload List Search
Perform a cone search by typing either an object name or the coordinates directly. Multiple object names, coordinates, or combinations of both are allowed by pressing 'return' or 'tab' keys after each object. Use the 'UPLOAD LIST OF TARGETS' button to upload a comma-separated file containing the object names, coordinates, or specific dataset IDs. Users can set the size of their cone search in arcminutes or arcseconds. This section is not required to conduct a search: users can leave it blank and search based only on other parameters. To start querying, click the Search bar at the bottom of the page.| Note |
|---|
Object names in this component are used only to resolve into coordinates using a name resolver. |
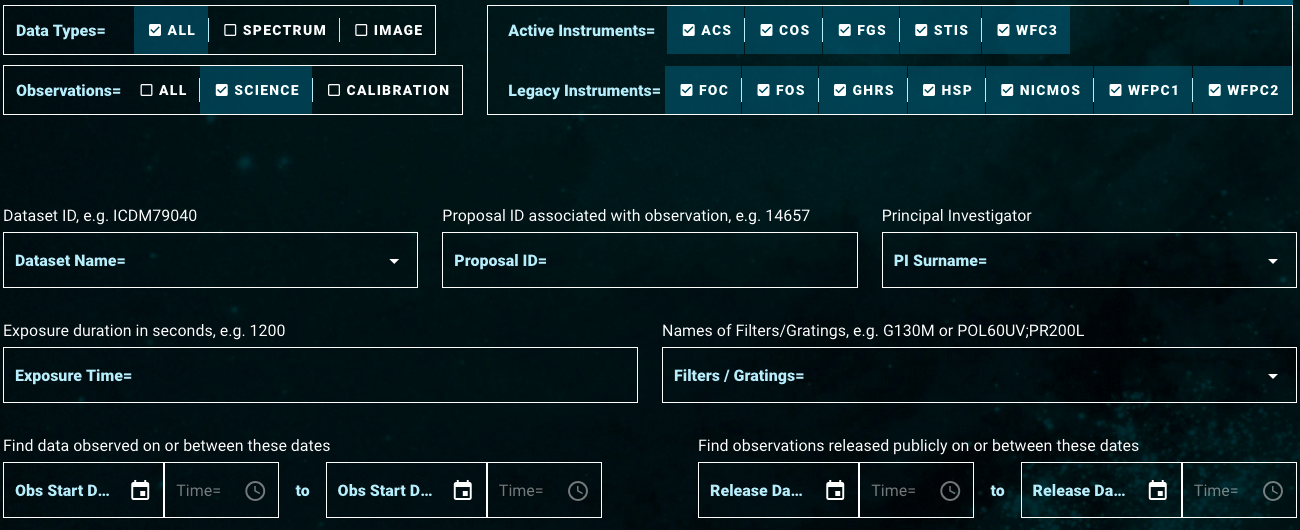
2. Search Parameter Overview
Use these fields to build advanced searches. Add search constraints based on the most commonly used observation parameters like instrument, proposal information, filter/grating, or start/end times. Each parameter accepts regular expressions, for example, greater than or less than for numerical fields or wildcard characters for string fields. If the default filters on the component do not include the specific parameter needed, see the 'Add Condition' section below for further search options.

3. Add Condition
Use 'Add Condition' to further constrain the search. Search for a column based on names and descriptions, or scroll through the complete list in the 'Column Name' text box. The search condition can include numerical constraints or wildcard characters for string fields. Use the 'ADD ANOTHER CONDITION' button to add multiple constraints and columns.
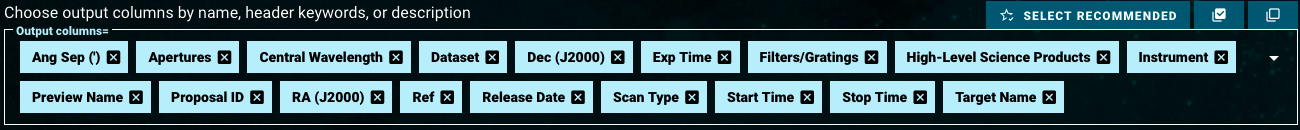
4. Choose Output Columns
Use 'Output Columns' to select which columns to include in the search results. The form is set by default to return a subset recommended by MAST. Use the shortcuts in the upper right to select 'Recommended' ( ), 'All' (
![]() ), or 'None'(
), or 'None'(![]() ) of the columns. Click in the 'Output Column' box and start typing to search for columns or click the check box in the pop-out menu to select based on its name or description. Remove individual columns from the selected ones by clicking the 'x' next to its name.
) of the columns. Click in the 'Output Column' box and start typing to search for columns or click the check box in the pop-out menu to select based on its name or description. Remove individual columns from the selected ones by clicking the 'x' next to its name.

5. The Search Bar
The search bar is always located at the bottom of your screen. Clicking the 'SEARCH' button starts the search. Clicking the 'SHOW API QUERY' button generates a script using the Application Programming Interface (API) for MAST Mission Search, based on the search parameters entered into the form. This can be a great way to learn how to construct queries programmatically. Reset the form using the 'CLEAR FORM' button on the left.
Search Results Table
| Anchor | ||||
|---|---|---|---|---|
|
| Panel | ||||||||
|---|---|---|---|---|---|---|---|---|
| ||||||||
Figure 2 — The major components of the – The results table after a search for Hubble data. |
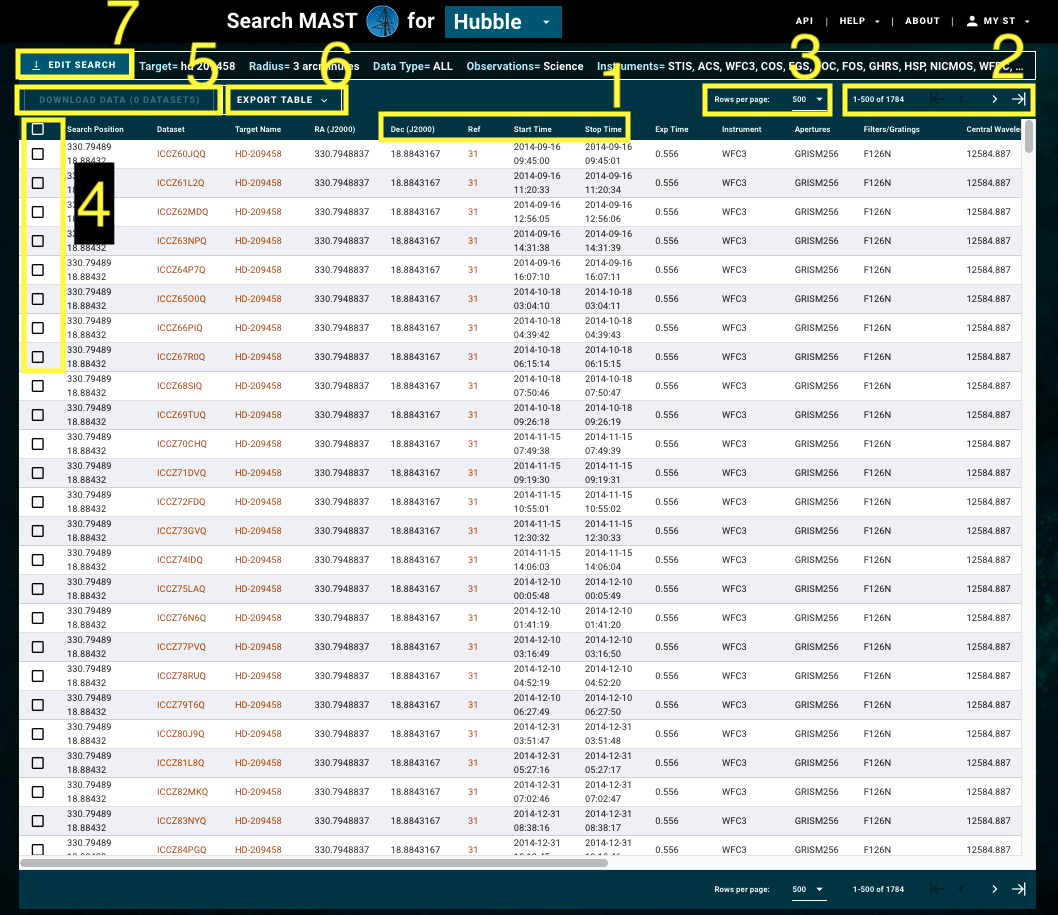
The search results table
.Summary Of The Major Components: Front-Page Search Form
Summary Of The Major Components: Search Results Table
contains observations that match the search parameters. If a list of targets (object names, coordinates, or dataset names along with other information) is uploaded, all uploaded parameters will be included as additional columns in the results table. See the section Cone Search And Upload List Search for valid file formats.

1. Sorting Columns
The search results table can be sorted in ascending or descending order by clicking on the column name. The arrows indicate the sort direction. The table supports multi-column sorting, where the number next to each sorted column indicates the order. In the example on the left, the search results table is sorted first by Instrument name in ascending order, second by Exposure Time in descending order.

2. Pagination
When there are more search results than the page size (default page size is 500 results per page), the table relies on pagination to display the records one page at a time. Iterate through previous or next pages, or jump to the first or last page, using the arrow buttons.

3. Table Rows Per Page
Updating the 'Rows Per Page' drop down changes the number of rows displayed on the table. For queries that return more than a few hundred results, displaying fewer rows per page will enable quicker loading. For queries that have less than a few hundred results, showing more rows per page can be convenient to see more on a single page.

4. Row Selection
Select one or more rows to download products associated with those datasets by clicking the checkboxes next to individual observations. The top checkbox in the header row selects all rows on the current page. Deselect individual rows using the checkboxes in those rows. Note that selecting or deselecting rows is limited to one page at a time. However, row selections on each page will be remembered between pages of the whole results table. To select rows across many table pages, try refining your search to be more selective, apply sorting of columns to group them together, or use the API (programmatic access to allow searches or downloads with scripts).
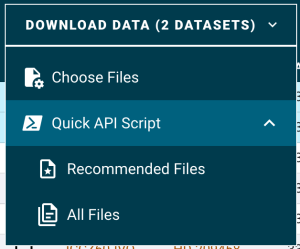
5. The Download Button
To download products associated with the observations in the search results table, select at least one row of observations. Then use the 'DOWNLOAD DATA' button to access the Download Overlay by selecting 'Choose Files' or generate an API script with one of the 'Quick API Script' options. When selecting more than 2000 observations, the 'Choose Files' button is disabled; instead, either reduce the number of selected rows or use the 'Quick API Script'option to programmatically retrieve the products from the selected observations. See 'Show API Button' in the Download Overlay for more information about API queries.

6. The Export Button (Exporting Search Results Table)
Export the metadata of the search results table in a comma-separated (CSV), JSON, or VO Table format. To do this, select a subset of the table rows or the entire table of search results. Unlike downloading datasets, there is no limit to the number of rows that can be exported.

7. The Edit Search Button
Use the 'EDIT SEARCH' button to update the search parameters or start a new search. The search form will be overlaid and remember the previous query parameters, which can be modified. Press the 'CLEAR FORM' button at the bottom left of the screen to start a new search.
Download Overlay
| Anchor | ||||
|---|---|---|---|---|
|
| Panel | ||||||||
|---|---|---|---|---|---|---|---|---|
| ||||||||
Figure 3 – The download overlay panel, with selectors or action buttons highlighted in numbered boxes. The overlay selectors vary slightly among missions; this graphic applies to JWST. |
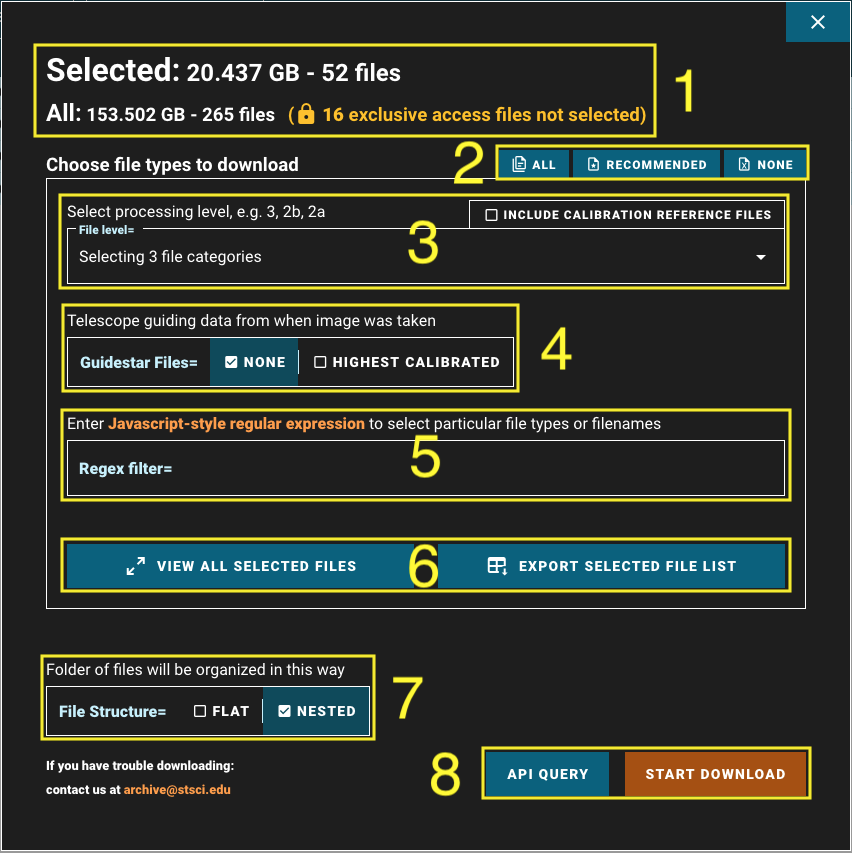
Each dataset contains one or more products (i.e., files), including calibration files, ancillary data, and calibrated files at various levels of processing. It is possible to download specific file types across the datasets or all the files that are available. The download overlay allows filtering by product types, and selection of specific files to download from each dataset. Files that are selected using the checkboxes remain selected to be downloaded even if additional filters are applied in the overlay to make them no longer visible in the overlay. The selectors and action elements are described in detail in the Download Overlay article.