Page History
| Excerpt | ||
|---|---|---|
| ||
Browse and visualize data products in the MAST Portal. |
| Panel | ||||||
|---|---|---|---|---|---|---|
| ||||||
The MAST Portal offers a variety of browsing and visualization tools, most of which are described in the Browsing Data chapter of the Portal Guide. On this page...
|
Browsing and Visualization
The MAST Portal provides functionality to assess the applicability of search results to your scientific purpose. See the Portal Guide for details, including descriptions of the following:
- See Browsing Data for a high-level view of manipulating search resultshow to navigate between multiple searches.
- See the Search Results Grid for tools that help you make use of browse observation metadata, or capture the results of a query as a persistent URL.
- See Refining Results with Filters to augment the result selection criteriadown-select which results are presented.
Tools for browsing the content of data files are available via links embedded in each row of the table. Only tools that are applicable for the search result data type(s) have active buttons or links. See the following articles in the Portal Guide for extensive descriptions:
- See Data Browsing Tools
- Astroview (and see the following subsection)
One Portal tool in particular, the (1-D) spectrum viewer tool, does not currently work with JWST spectra. However, a web-based version of the Jdaviz tool can be used instead. See the Jdaviz summary below.
Browsing with AstroView
The search results page includes the AstroView Tool, which displays a region of a sky survey centered on the coordinates of the target. See Figure 1 below for a visual summary, and the Portal Guide chapter on AstroView for the detailed description.
- for options to display image thumbnails or cutouts, overlay an image on a sky survey, or view timeseries data.
- See the Astroview tool for displaying wireframes of search results superimposed on a sky survey
| Anchor | ||||
|---|---|---|---|---|
|
| borderColor | #00617E |
|---|---|
| bgColor | #E3EEF1 |
| borderWidth | 2 |
| borderStyle | solid |
Figure 1 — AstroView Tool shows footprints of the searched observations next to the Filters and the table results. After successfully searching JWST observations, AstroView shows the footprints (green rectangles) of all retrieved JWST observations (including footprints from the instrument detector locations), as seen in Figure 1. Once an observation is selected in the List View tab (seen in the pink circle), the selected footprint is colored in white (in this image, NIRCam). Multiple observations can be selected as well.
Data VisualizationThe primary aim of data visualization in the MAST Portal is to enable the discovery and selection of data that are relevant and of sufficient quality and depth to address the searcher's scientific goals.
This is particularly important for spectroscopic data. For JWST, which produces very advanced data products, a new, more capable tool takes the place of the classic spectral viewer tool.
The Jdaviz package enables quick-look and analysis in your browser of JWST Level-3 spectroscopic data products.
JWST level 3 spectroscopic data products are available for quicklook and analysis in the web, using the Jdaviz package. Follow this tutorial to learn how to view the default Minimum default Minimum Recommended Product for an observation after performing a Portal Basic Search for Observations. For more detailed documentation, see the complete Jdaviz in MAST guide.
Step 1: Perform a Portal Basic Search for Observations
Step 2: After performing a basic search in the Portal, a new Jda action icon will displayed indicating that the current observation has data products viewable in Jdaviz (see Figure 1). See the Coming From the PortalThe following example illustrates how to invoke the Jdaviz tool in the MAST Portal.
| Instruction | Notes | |
|---|---|---|
| 1 | Perform a Portal search by target or coordinates. A basic or advanced search work equally well. See the Jdaviz Portal Search page for |
more detailed information on navigation from the Portal basic and SI keyword search pages. |
| ||
| 2 | A Jda action icon will appear for rows in the results table that are viewable with the Jdaviz tool. |
|
| 3 | Click |

| borderColor | #00617E |
|---|---|
| bgColor | #E3EEF1 |
| borderWidth | 2 |
| borderStyle | solid |
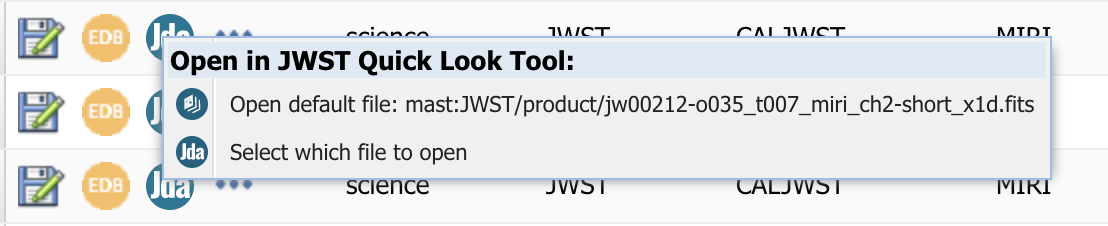
Figure 1 — The Jda Action icon (upper), indicating the observation row has data products viewable in Jdavi;. and the Action dropdown menu (lower) with options to display the default Minimum Recommended Product in Jdaviz, or to find all related data products associated with the observation that are viewable in Jdaviz.
Step 3: Clickthe Jda action icon to reveal a dropdown menu, with |
multiple options |
. Select the first (default) option, which will display the default Minimum Recommended Product in Jdaviz. For information for the option Select which file to open |
, see |
| ||
| 4 | The "Search through other data products related to this observation" option will open a new browser tab | |

and load the designated data product into the "Jdaviz in MAST" |
web application. The result will look something like the figure below. This specific example shows the file jw01128-o007_s00002_nirspec_f070lp-g140h-s200a2-subs200a2_x1d.fits 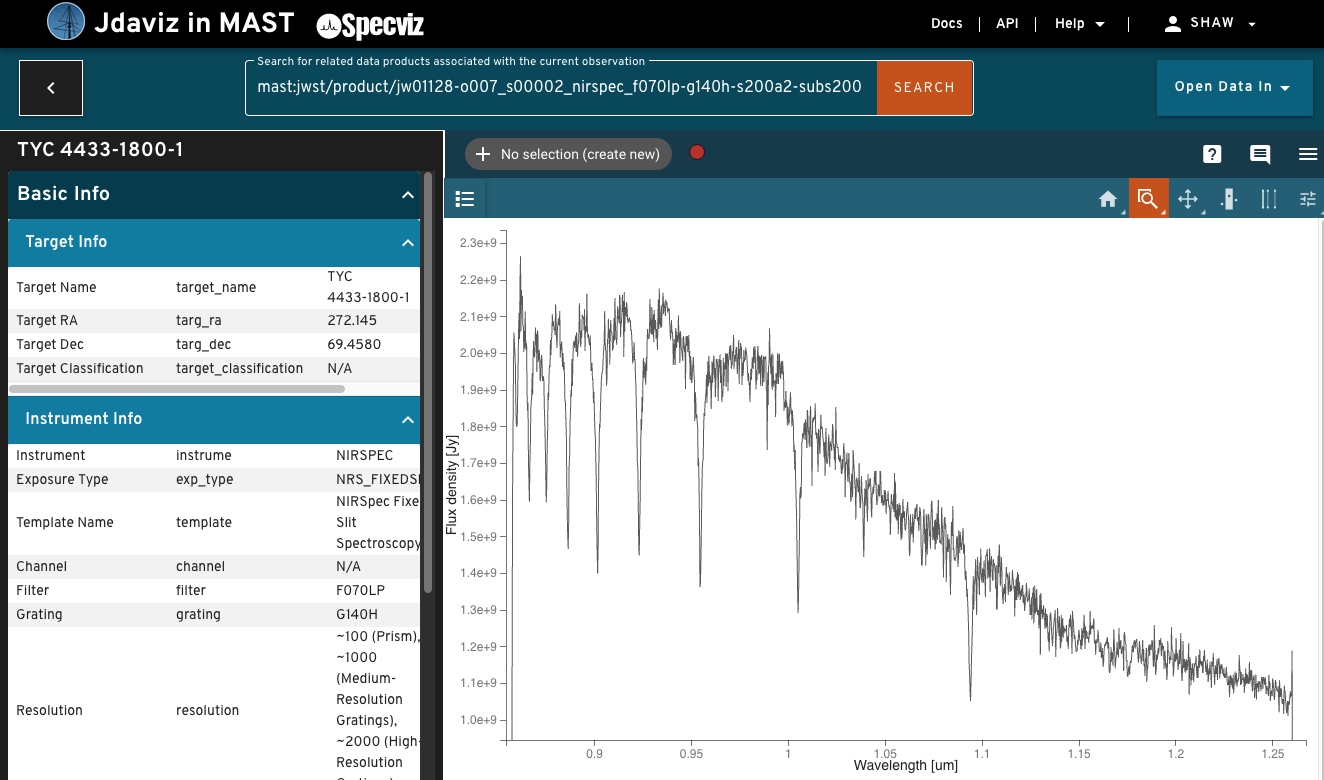 |
Once
| Panel | ||||||||
|---|---|---|---|---|---|---|---|---|
| ||||||||
Figure 2 — The Jdaviz in MAST quicklook and analysis page, with displayed data product visualized in the Jdaviz Specviz configuration. |
Step 5: Once loaded, the Jdaviz in MAST spectroscopic quicklook page can be used to quickly inspect a inspect a spectroscopic data product. On the left-hand side is a sidebar panel of information. In the center/right the data product is loaded into the Jdaviz application. Jdaviz has different configurations which are optimized for different types of data products, i.e. 1d, 2d1-D, 2-D, or 3d 3-D spectroscopic data. The example shown in Figure 2 above has loaded data into the the Specviz configuration. For a complete description of the quicklook quick-look page and the available Jdaviz configurations, see the Viewing Individual Spectra for article (not yet available) for more details
For Further Reading...
- MAST Portal Guide
- Browsing Data in the Portal
- Data Browsing Tools in the Portal
- Jdaviz in MAST (not yet available)