This page is still being populated. Please be patient. We will provide more answers as time allows.
The Pan-STARRS project
What is Pan-STARRS? Why was it done?
What types of data were obtained? What can they tell me about the sky?
How does PS1 compare to other surveys such as the Sloan Digital Sky Survey (SDSS)?
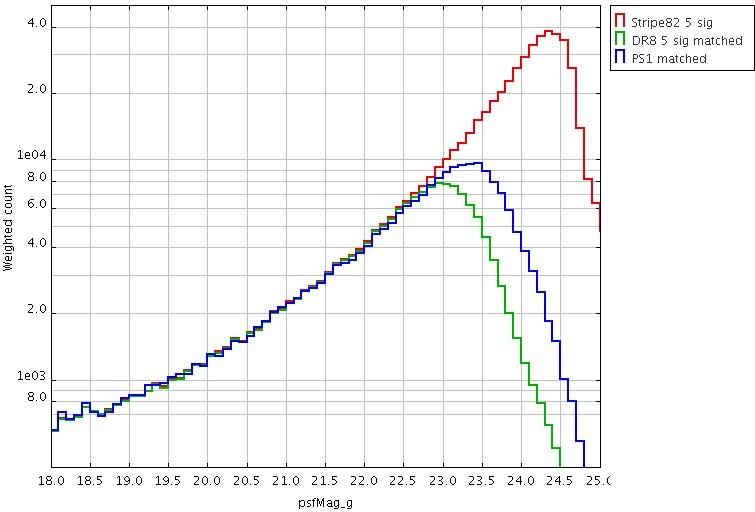
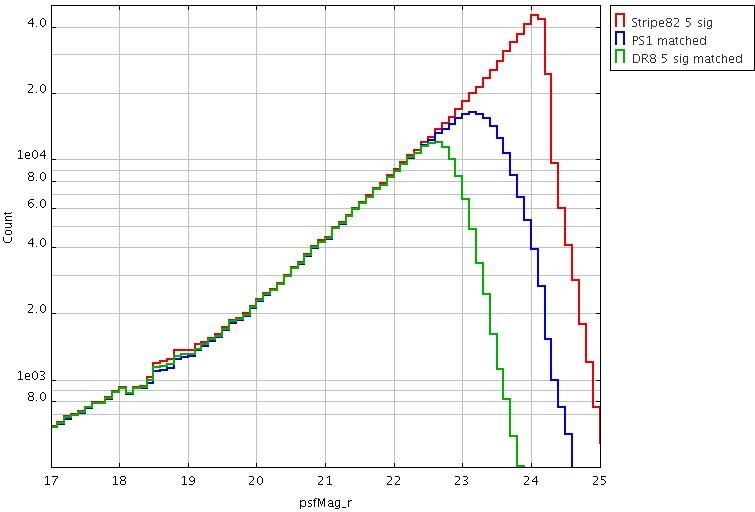
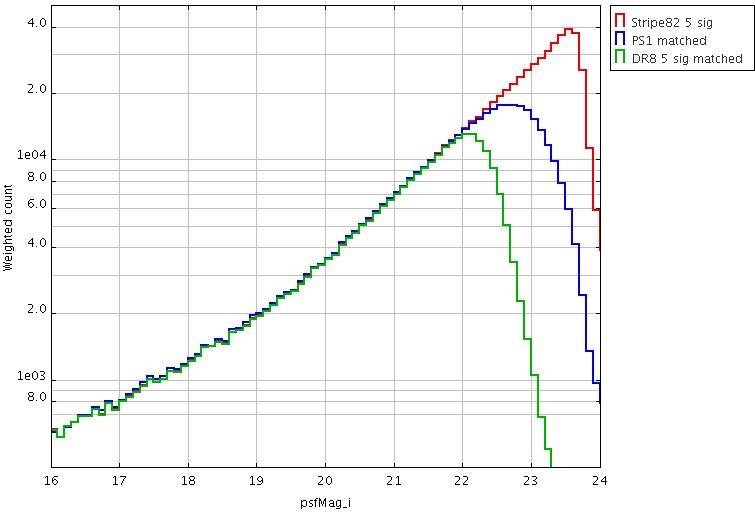
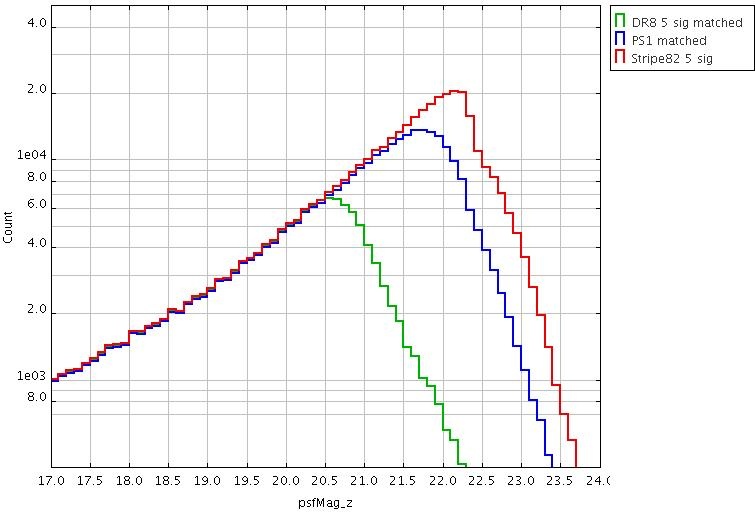
Metcalfe et al. MNRAS 435, 1825 (2013) - has a detailed comparison of the PS1 Small Area Survey 2 data (a test 3pi region taken under optimal conditions) with SDSS. Here are plots comparing 5-sigma counts from SDSS DR8, PS1-SAS2 and Stripe 82. This is a best-case scenario. Generally speaking, averaged over the whole sky, PS1 is similar in depth to SDSS in g and r, ~0.5 deeper in i and ~1 mag deeper in z (for point sources).
PS1 data access
What should I know about the current data release?
Users of the current PS1 DR1 data should be aware of a few issues and inconsistencies in the data.
See the PS1 DR1 caveats page for more information.
How do I get started? Are there examples of data queries?
How do I get PS1 data for a list of sources I have?
The How to retrieve and use PS1 data page describes the three current interfaces to access the PS1 catalogs. All of them can be used to cross match a list of sources.
- Follow the File Upload Form link in the upper right corner of the simple web form to cross-match a list of positions with the catalog.
- Use the VO Cone Search interface in a script to query many positions. This is easily accomplished, e.g., in Python. Note that it is possible to get results back from this interface in a variety of formats, not just in VOTable format. See the documentation for more information.
- Large cross-matches can be carried out in Casjobs. These queries can be customized to extract only the columns of interest and to apply constraints based on additional catalog information (e.g., to require that the object be detected in a particular filter). One of the SQL query examples in Casjobs shows how to do a cross-match. Login to Casjobs, go to the Query page, select the PanSTARRS_DR1 context, and click the Samples button (just below the context menu). The PS1 crossmatch query does a cross-match with one of your MyDB tables:
/* Create a table of positions within a file in your local directory that looks like this

ID, RA, DEC
1, 1.58851, -0.07845
2, 5.53825, -1.51730
3, 6.33772, -12.34491

Upload this file into MyDB as a table named MySources using the Import tool in CasJobs.
Run the following query to obtain the PS1 catalog information
about matches that lie within 20 arcseconds of the search positions.
Reports input values, PS1 positions and PSF magnitudes. */

select s.ID, s.ra, s.dec, o.objID, o.raMean, o.decMean,
   o.nDetections, o.ng, o.nr, o.ni, o.nz, o.ny,
   m.gMeanPSFMag, m.rMeanPSFMag, m.iMeanPSFMag, m.zMeanPSFMag, m.yMeanPSFMag
from MyDB.MySources s
cross apply fGetNearbyObjEq(s.ra,s.dec,20.0/60.0) nb
inner join ObjectThin o on o.objid=nb.objid and o.nDetections>1
inner join MeanObject m on o.objid=m.objid and o.uniquePspsOBid=m.uniquePspsOBid
What tools are available to extract and examine PS1 data?
How do I access PS1 image data?
See the documentation on the PS1 Image Cutout Service for information on how to access the PS1 image data. There is a simple web interface that provides access to JPEG previews, FITS cutout images, and full-frame FITS skycell images. The web interface also creates color images by combining the 5 PS1 filters. The interface provides services that can be used for scripted downloads of large numbers of cutouts.
PS1 catalog data
How do I make sense of the entries in the PS1 data tables?
The PS1 databases are complex, with information stored in many different tables. The PS1 Sample queries page gives some examples that can be helpful in getting an overview of the use of the tables. The PS1 Database object and detection tables page has detailed descriptions of the tables that have data on individual objects. You can search within this page for particular columns or quantities. There are other pages that describe tables with observational metadata (e.g., exposure dates and times) and catalog metadata (e.g., information on flags).
How can I distinguish stars from galaxies in the catalog?
There are several possible approaches to separate extended objects from point sources. See the page describing how to separate stars and galaxies for suggested approaches.
PS1 astrometry
How good is PS1 astrometry?
The positions of DR1 sources were originally determined from the astrometric calibration of PanSTARRS using sources in common with the 2MASS catalog. The systematic uncertainty in this calibration is not precisely known, but is likely to be close to 0.1".
However, the positions of the mean objects in the DR1 release catalog were recalibrated using Gaia DR1 positions as additional constrains in the astrometric solution. The Gaia measurements were given very high weight, as detailed in Magnier et al. (2016). A comparison of Gaia and PanSTARRS positions for the objects in common yields a typical residual of 5 mas (1-sigma, 2-d), with a slightly higher component in the direction of right ascension. This comparison may not fully reflect PanSTARRS position errors, because of the correlation in the quantities that weer compared (Gaia measurements are included in the determination of individual PanSTARRS positions).
An independent test of sources with Gaia data that were not used in the recalibration suggests that the residual systematic uncertainties for recalibrated PanSTARRS positions is closer to 20 mas (1-sigma, 2-d) for sources with Gaia magnitudes between G=15 and G=18, increasing for fainter magnitudes to about 35 mas at the Gaia magnitude limit (G=21.7). Errors are larger towards brighter magnitudes as well, possibly because saturation and proper motion effects become significant in the PanSTARRS measurements. It is likely that systematic uncertainties of 20 mas (1-sigma, 2-d) apply to all mean objects in PanSTARRS DR1, with possibly larger uncertainties in regions with a scarcity of sources in common between Gaia and PanSTARRS. In addition, each mean source has a statistical measurement uncertainty reported in the following fields in the ObjectThin table:
| raMeanErr | arcsec | REAL | 4 | -999 | Right ascension standard deviation from single epoch detections. |
| decMeanErr | arcsec | REAL | 4 | -999 | Declination standard deviation from single epoch detections. |
Note that the stack object astrometry has not been recalibrated with Gaia constraints, and therefore is likely to include the larger systematic uncertainty from the 2MASS calibration.
As an additional caveat, stars with high proper motion (> 1"/yr) are likely to be split into multiple mean objects; proper astrometric solutions for such sources require use of individual detections (which will be available in DR2) and epoch-aware co-processing. Similarly, objects with high proper motion might appear elongated in stacked data and may not be properly identified as point sources.
TBD: produce plot of stack vs mean positions for a small area, and quantify 2MASS residuals better. Produce useful plots of residuals. Include USNO plot after asking permission. Credit USNO-led comparison explicitly if appropriate.
PS1 photometry
What filters did PS1 use?
The PS1 camera surveyed the sky using 5 filters: g, r, i, z, and y. The effective wavelengths (and spectral resolutions) of these 5 filters are 481 nm (R = 3.5), 617 nm (R = 4.4), 752 nm (R = 5.8), 866 nm (R = 8.3), and 962 nm (R = 11.6), respectively. Please refer to Table 4 in Tonry et al. (2012) for bandpass details. Schlafly et al. (2012) provides updated zeropoints in Table 1.
How good is PS1 photometry?
The PS1 photometric system is shown by Schlafly et al. (2012) to have reliability across the survey region at the level of (8.0, 7.0, 9.0, 10.7, 12.4) millimags in (g, r, i, z, y). The Haleakala site is good enough to enable <1% photometry over much of the sky. The PS1 photometric calibration pipeline process is described in Magnier et al. (2016).
Which magnitudes should I use?
There are several different kinds of magnitudes in the PS1 catalog (aperture, PSF-fitting, Kron, etc.), and there are also several different sources for those magnitudes (means from multi-epoch measurements, measurements from deep stack images, "forced mean" measurements where a stack image is used to identify objects but the photometry is determined by fits to the single-epoch warp images). Which magnitude should you used for your science?
A comparison between different photometric measures provides some guidance. The answer is complex, but here is a high-level summary:
- For point sources use PSF magnitudes.
- Mean PSF magnitudes have the lowest noise (because the PSF model is most accurate in single-epoch images). They are good for brighter objects, but for objects near the single-epoch detection limit they will be biased (due to the absence of sub-threshold detections), and objects too faint to detect in a single epoch are missing.
- Stack PSF magnitudes are noisier because the PSF model is less accurate. But the stack detections are more than a magnitude deeper and so have many more faint objects than mean detections.
- Forced mean PSF magnitudes use PSF-fitting photometry on the single-epoch images at positions of stack detections. They are a reasonable compromise: they have slightly lower noise than the stack PSF magnitudes, and they are deep and unbiased (because they use data from all warps). Their noise is higher than the mean PSF magnitudes, however.
- For extended objects use Kron magnitudes.
- Stack Kron magnitudes are usually the first choice as a general-purpose, deep magnitude.
- de Vaucouleurs and exponential model fits could be better in some cases, and the mean measurements can be useful for objects that are barely resolved (where the PSF is important).
- Extended object photometry using the PS1 catalog will require research and analysis by the user to determine the best approach.
What are the brightest and faintest stars for which the data are reliable?
The answer is it depends on band and FWHM. A very conservative estimate for the bright limit is as follows:
| g | r | i | z | y |
|---|---|---|---|---|
| 14.5 | 15 | 15 | 14 | 13 |
You may find individual fields where you can do up to a magnitude brighter than this.
The faint limits vary across the sky - see the section on the photometric depth.
How reliable is PS1 photometry of nearby, bright galaxies?
There are two main problems you should be aware of which affect bright galaxies:
(1) oversubtraction of the sky background - this affects most Messier galaxies and some (most?) of the larger NGC objects. As the background is subtracted independently from each filter, this can induce colour changes across the galaxy. In principle the polynomial used to store the background is stored and can be de-applied. However, as the subtraction is done at the warp stage, if you want stacked data the stacking procedure would have to be re-run. This facility is not available in DR1.
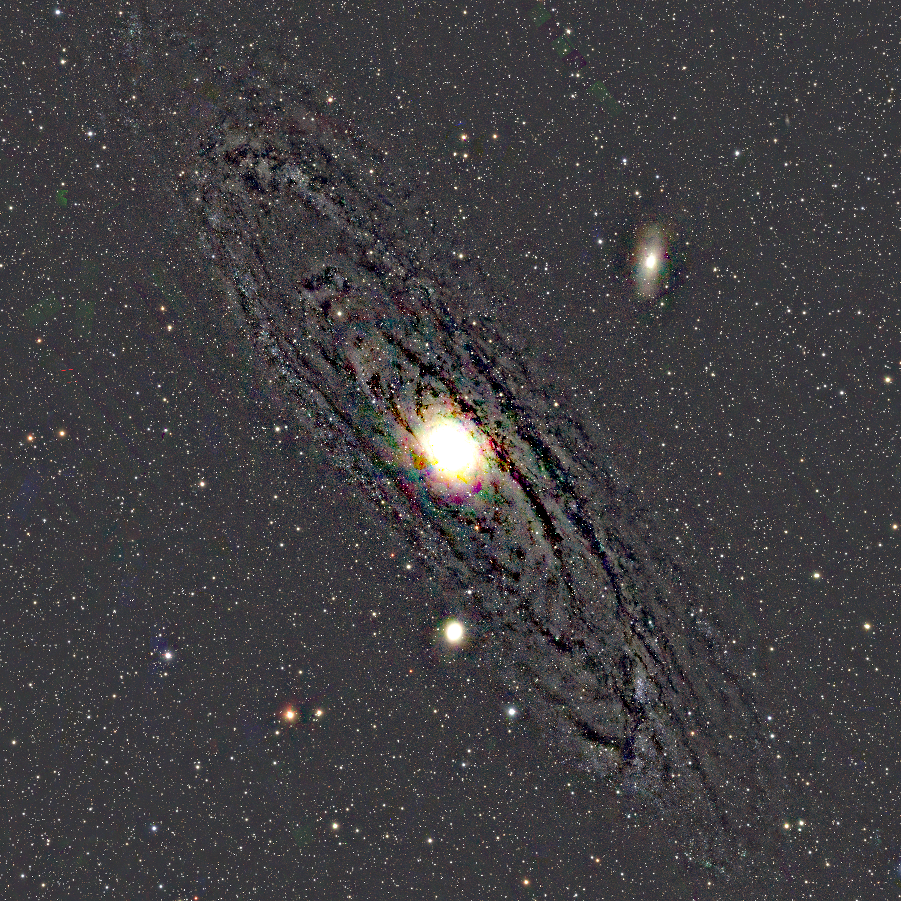 | Messier 31 from the 3pi stacks showing an extreme example of the over-subtraction of the background. |
|---|
(2) issues with the row-by-row bias and continuity corrections - these are applied and therefore seen on individual ccd scales (~600 pixels). As this is done at the detrending stage this is currently very difficult to correct. There is an aspiration to re-analyse all bright galaxies but this has not yet been done.
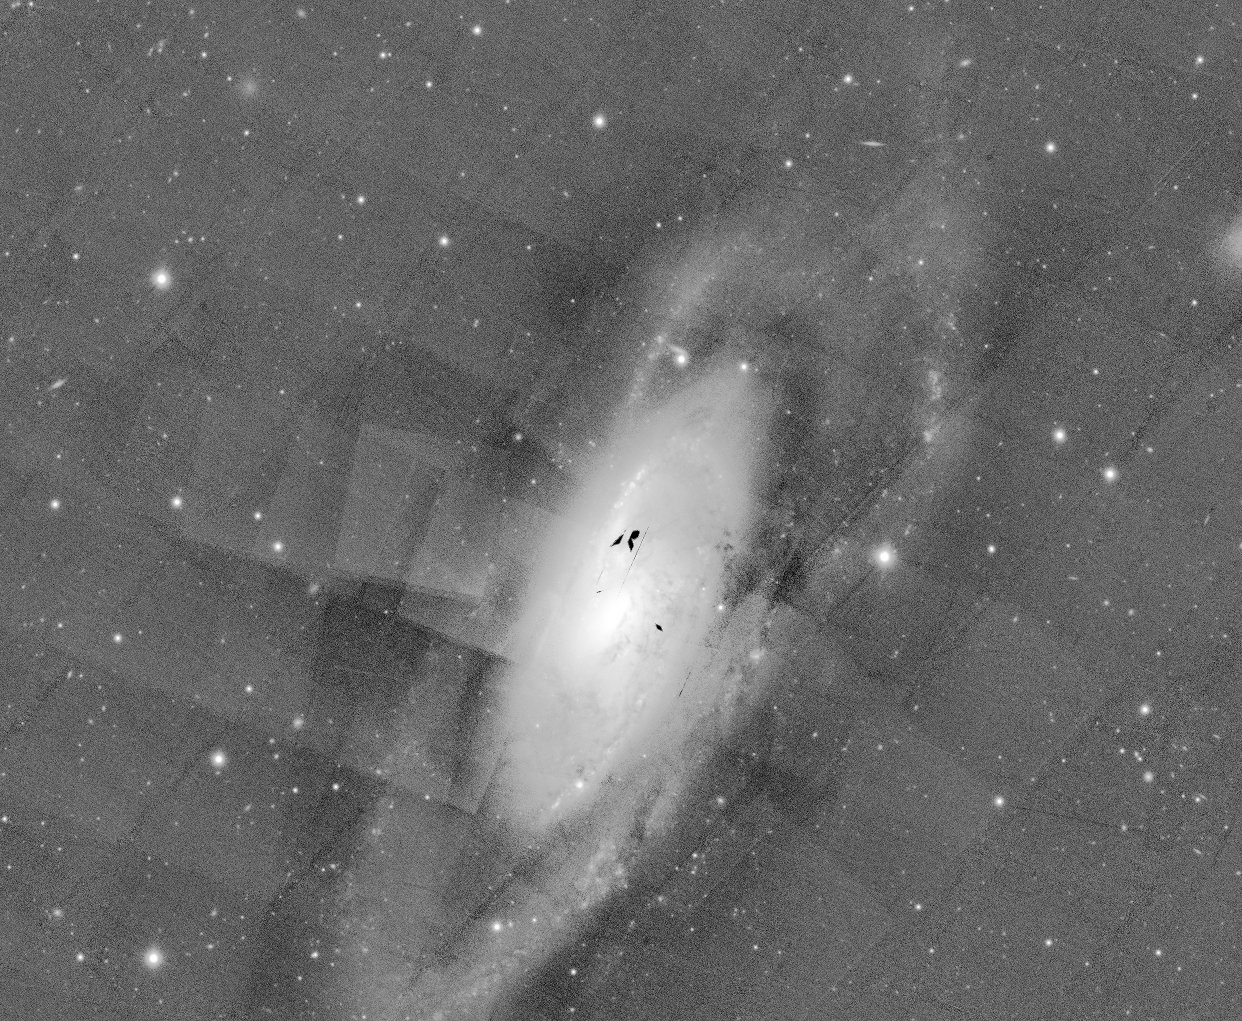 | Messier 106 - this is an extreme stretch of the r-band stack showing problems on the scale of individual ccds. |
|---|
Why is my photometry from images so different from the catalog photometry?
The pixel values in PS1 images must be transformed using a non-linear equation to convert them to fluxes before doing photometry on them. If you do not apply that transform, the photometry results will not be remotely close to the correct photometry. (Note that this transformation is required for full skycell images; smaller cutout images have already been converted to linear fluxes.)
Even after applying this non-linear transformation, photometry from the images will not match the catalog perfectly. The ubercal procedure was used to modify the photometric calibration using sources observed in multiple images. That allowed correcting small errors in the photometry that depended on the exposure conditions, the epoch of the observation, the position in the detector, etc. Since this calibration was completed after the creation of the images, the image FITS headers and flux scaling do not reflect the improvements. Measurements made directly from the images will consequently not be as accurate photometrically (or astrometrically) as measurements in the catalog.
Flux differences that originate from post-image calibration should be small, however. Gross differences in photometry are much more likely to result from not applying the non-linear flux transformation.
PS1 Images
How can I convert pixel values on the stack images back to the original counts?
The short answer is you can't really get from the stack pixel values back to measured counts.
The long answer is it depends on why you want to these values The stacks are a weighted combination of the single-epoch warp images, with some scaling to get the zero-point to 25, so although you can get back to the numbers on the stack frames, it is not clear how these will relate to the warp counts, although they probably agree within a factor of 2 or better.
It is not clear that you could ever reverse engineer the stacking to recover the actual sum of the input warp counts (although there is some information in the image headers which might help).
It is actually worse than this in some cases, because the exposure time recorded is not the true exposure time (warps can be dropped from the stacking process after the total exposure time has been calculated). In this case the numbers in the stack could be quite different from warp counts.
Also, sky has been removed, so if you wanted the number of total counts (object + background) to do photon counting S/N stats that would be tricky.
With these caveats, to get back to a version of the numbers on the stack frames, you can use this equation:
10**((zeropt+2.5*log10(exposure_time) - catalogue_mag)/2.5)
where the zeropt is 25 for the stacks.