This article describes the various Jdaviz configurations to view different types of spectra. For an explanation on navigating to the Jdaviz analysis tool, visit the page searching for Jdaviz-compatible data.
On this page...
Jdaviz Display Panel
The main display panel contains the Jdaviz python application. Jdaviz has multiple configurations designed to load and view different types of spectroscopic datasets. Which configuration is displayed in the MAST spectral quicklook page depends on the type of data product. See the Icon Nomenclature for quick reference guide to the different Jdaviz configurations, and the table JWST Instrument Modes in Jdaviz for a mapping between different JWST datasets and the recommended Jdaviz configuration for viewing the data. Below, we briefly summarize the currently supported Jdaviz configurations available in MAST. For further details, see the Jdaviz documentation homepage.
Each Jdaviz configuration is built from one or more viewers, displaying either a 2d image, a 2d spectrum, or 1d spectrum profile. Each viewer is fully interactive, enabling pan/zoom, subset region selection, image scaling, colormaps, and more. Each configuration also comes equipped with a series of analysis plugins for on-the-fly analysis.
Specviz
The primary configuration for 1d spectroscopic data sets. For JWST these data have x1d and c1d product suffixes. By default, Specviz consists a single 1d spectrum profile viewer (see Figure 1). See Display Spectra on how to manipulate data in the spectrum viewer. See Specviz Analysis Plugins for the types of plugins for spectrum analysis.
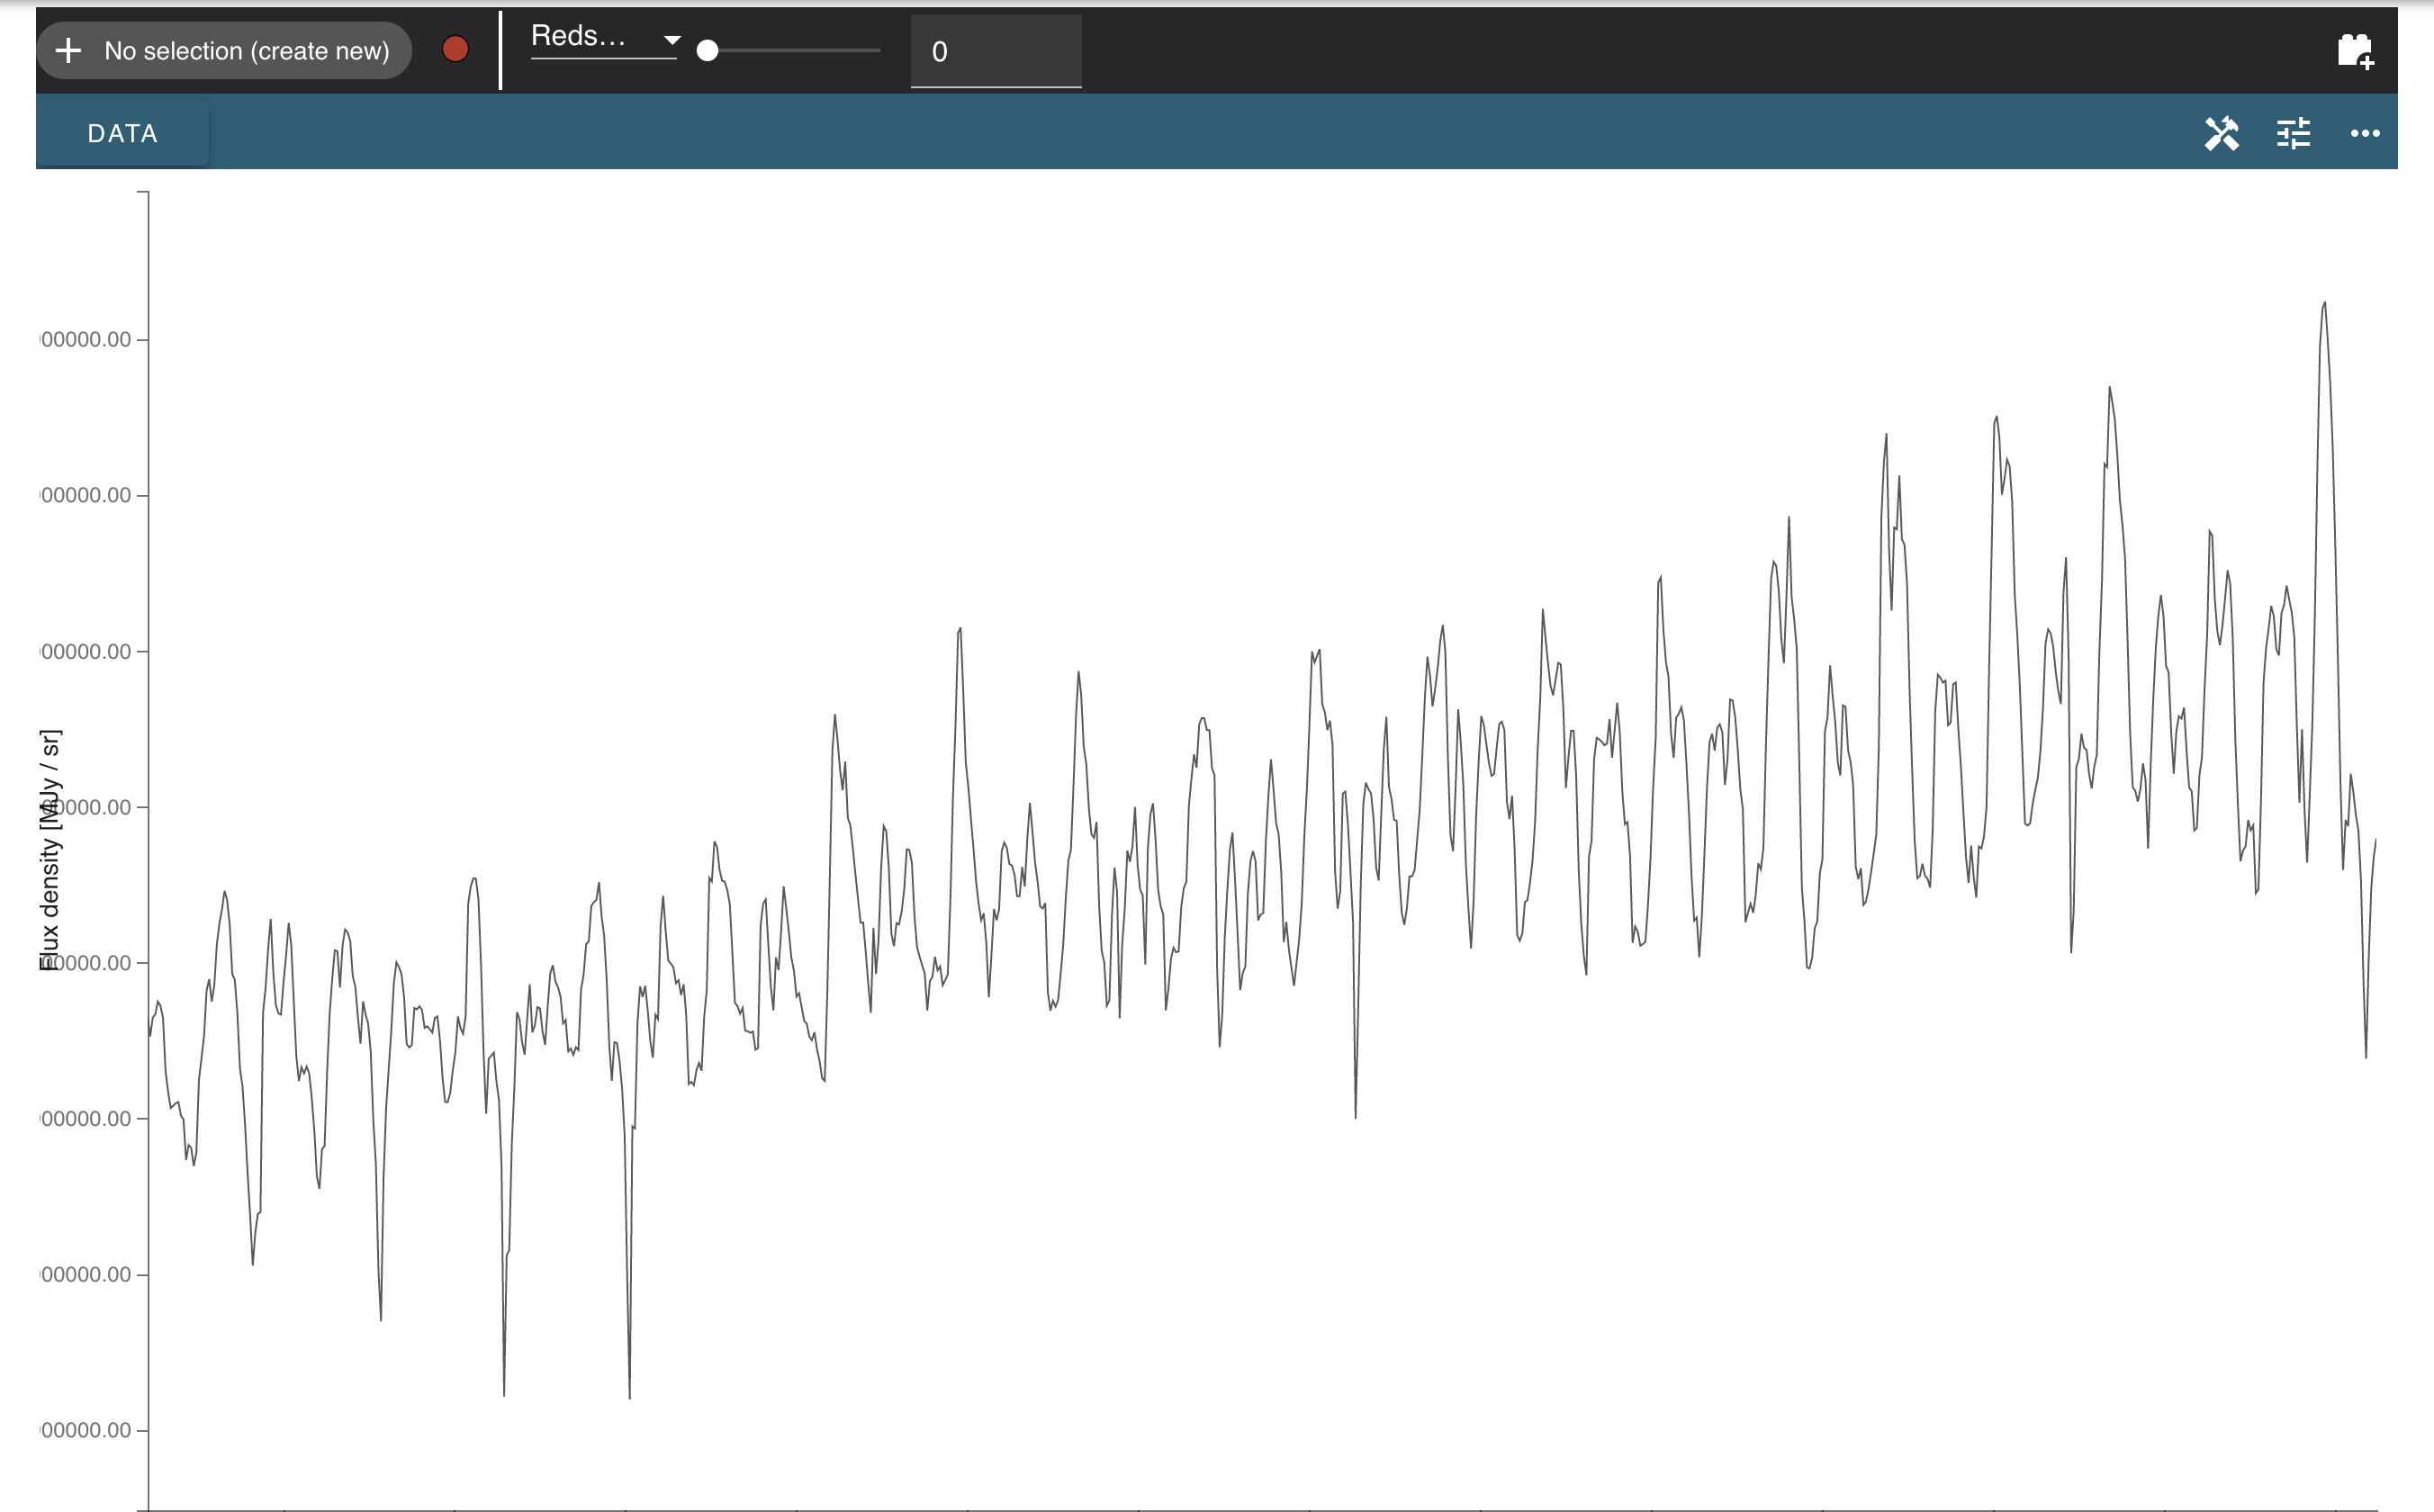
Figure 1 — The Jdaviz Specviz configuration, designed to load any 1d spectroscopic data product. By default, it consists of a single 1d spectrum profile viewer.
Specviz2D 
A pared down version of Mosviz, the Specviz2D configuration is used for displaying a single related pair of 2d and 1d spectroscopic data products, for instruments producing multi-object spectral (MOS) data products. For JWST these data have x1d and s2d product types, associated with the NIRSpec instrument. By default, Specviz2D consists of a 2d spectrum viewer, and a 1d spectrum profile viewer, that are linked together (see Figure 2). See Display Spectra on how to manipulate data in the spectral viewers. See Mosviz Analysis Plugins for the types of plugins for spectrum analysis.
Specviz2D is meant to display a related 2d and 1d spectroscopic data product for a given target, and thus can accept two data product files as input: a 2d spectrum file, and a 1d spectrum file. See Viewing Related MOS Data for navigating here from the Associated Data Products page. When both files are supplied, the 2d spectral file is loaded into the 2d spectrum viewer, and the 1d spectral file is loaded into the 1d spectrum viewer. To load both files when navigating to the page by direct URL, add the paired_uri or paired_file query parameters to specify the additional file. For example, the URL syntax for navigating and loading two spectral filenames is
https://mast.stsci.edu/viz/jwst/spectra?filename=[****_s2d.fits]&paired_file=[****_x1d.fits]
When only a single 2d spectrum file is provided, Specviz2D will load the 2d spectrum file into the top 2d viewer, and perform a simple 1d spectral extraction from the 2d file to load into the bottom 1d spectrum profile viewer.
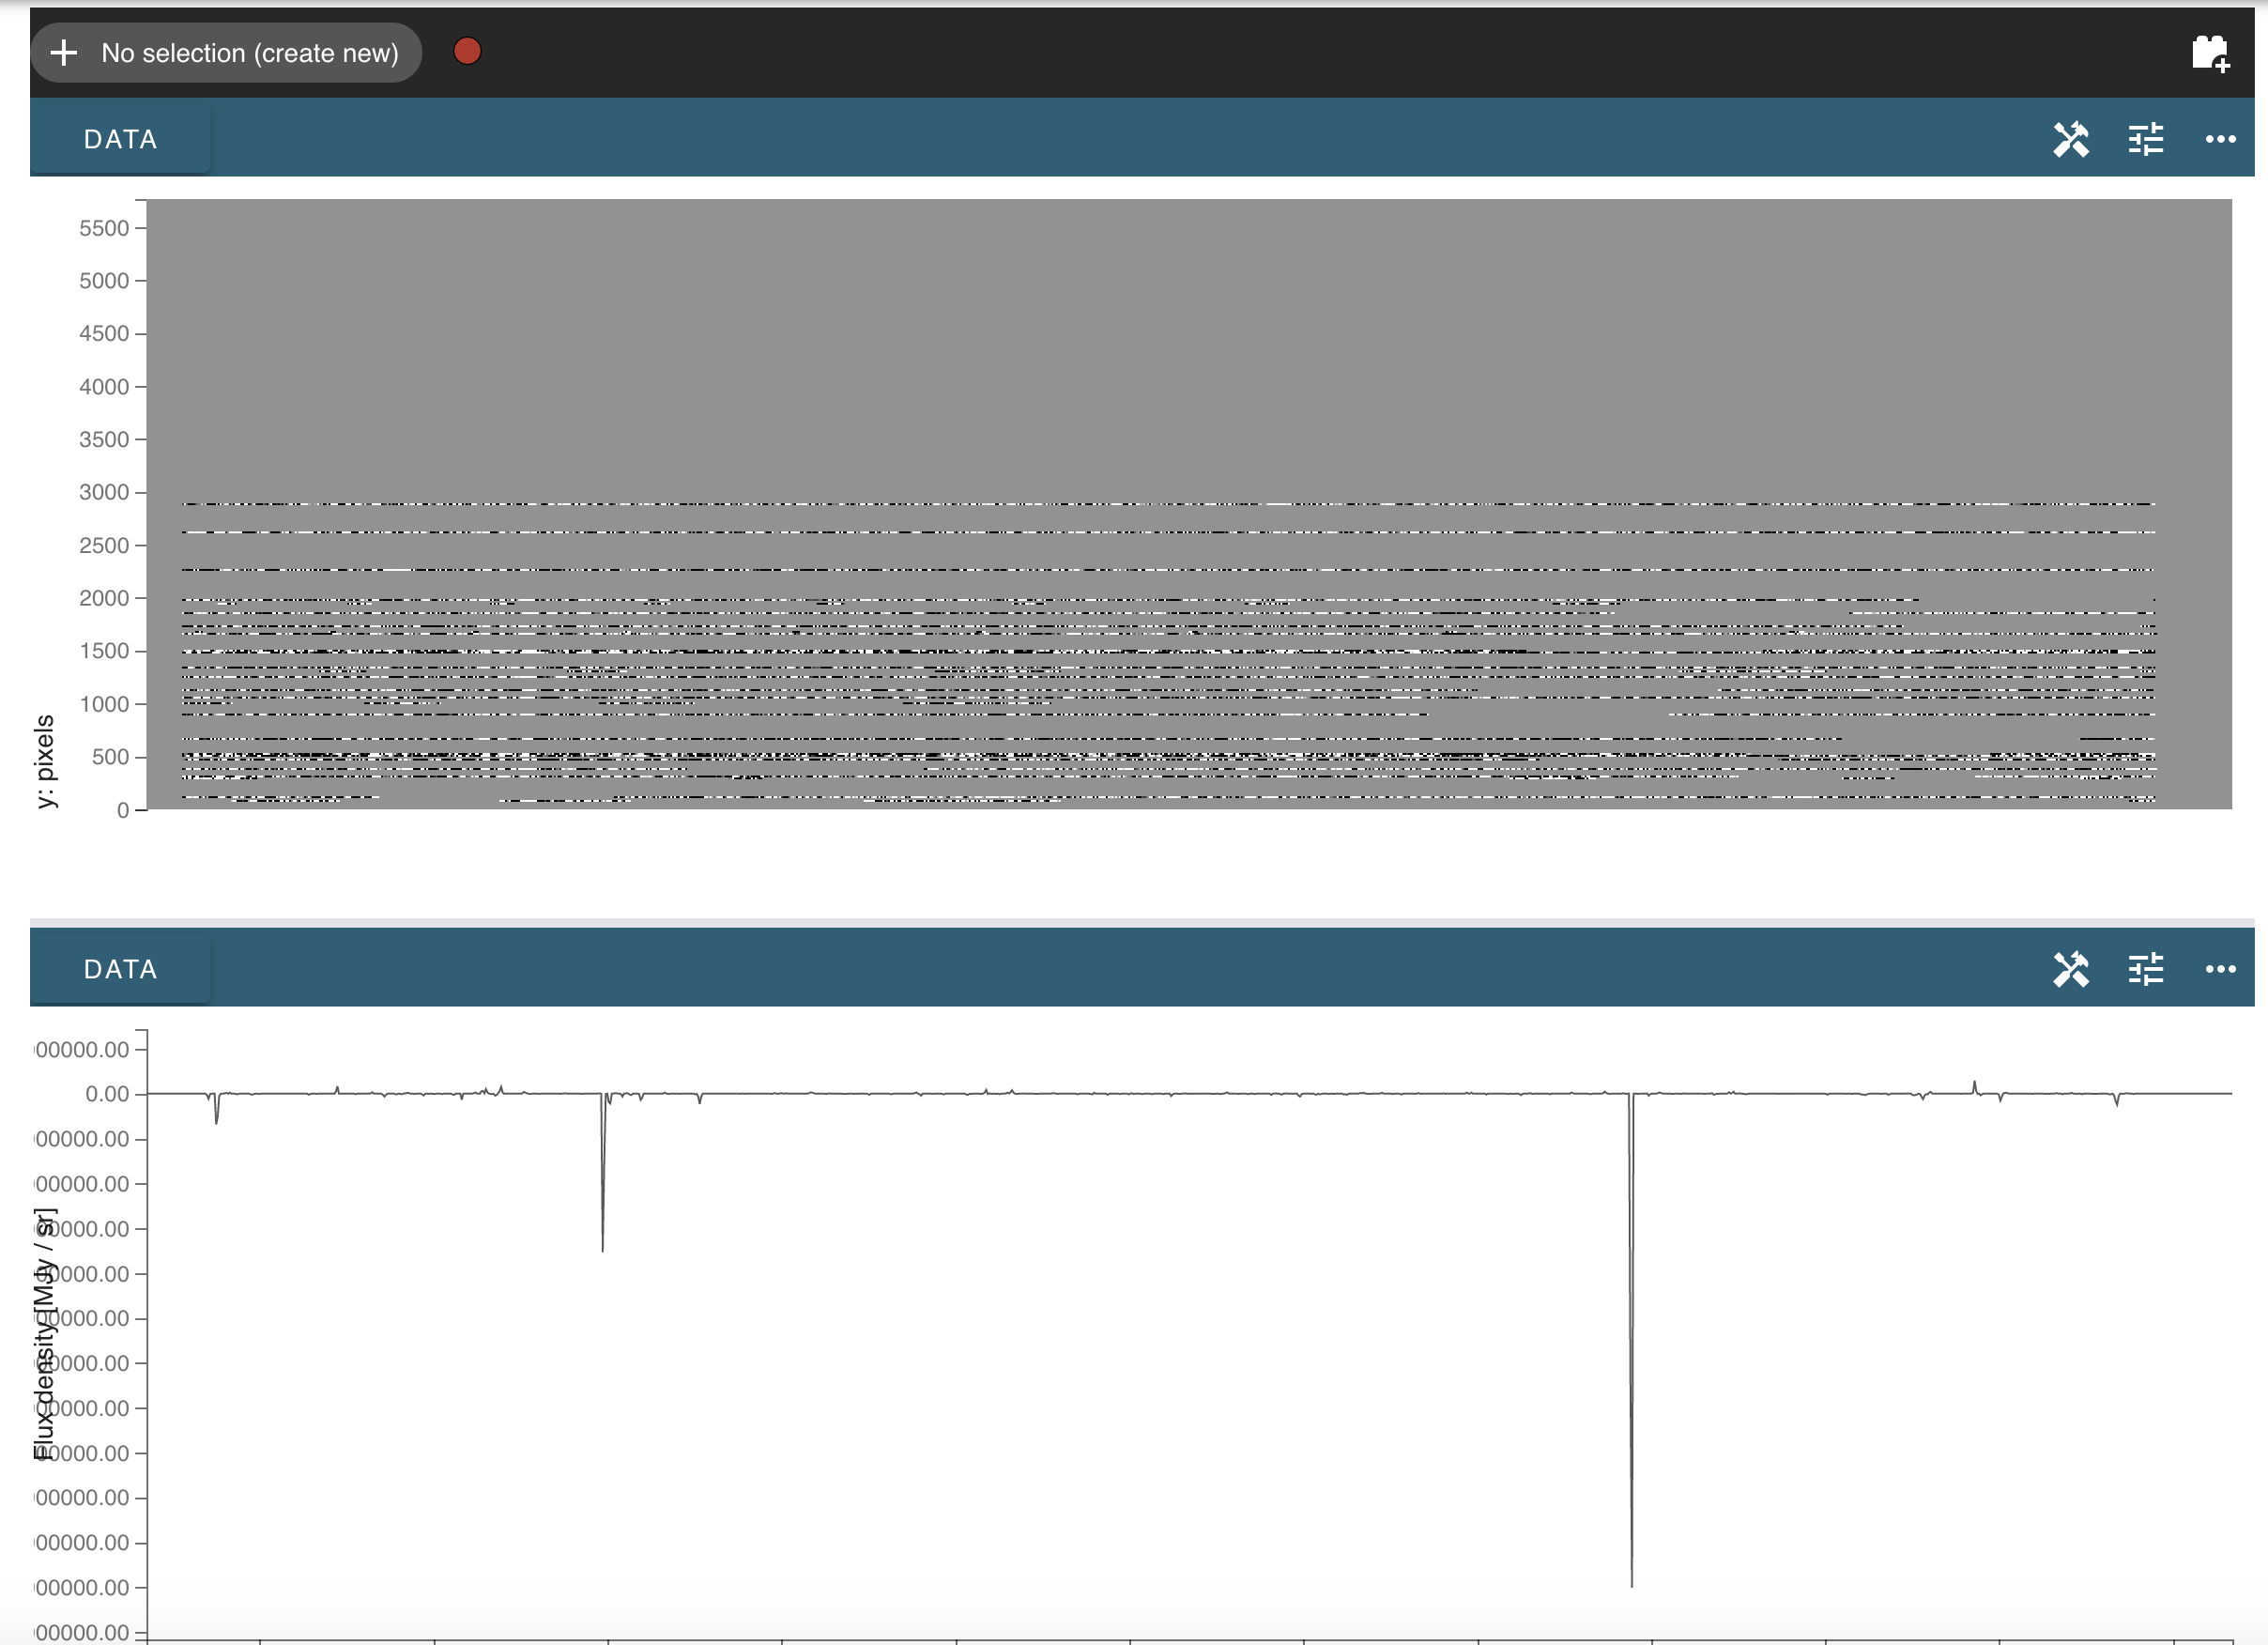
Figure 2 — The Jdaviz Specviz2D configuration, designed to display any related 2d and 1d spectroscopic data. By default, it consists of a single 2d spectrum viewer (top), and 1d spectrum profile viewer (bottom).
Cubeviz 
The primary configuration for 3d spectroscopic data sets, e.g. IFU spectral data cubes. For JWST these data have s3d product types. By default, Cubeviz consists of three image viewers, containing the flux, error, and data quality or mask, and a single 1d spectrum profile viewer, starting at the 0th spectral element (see Figure 3). See Displaying Cubes and Display Spectra on how to manipulate data in the cube and spectral viewers. See Cubeviz Analysis Plugins for the types of plugins for cube analysis.
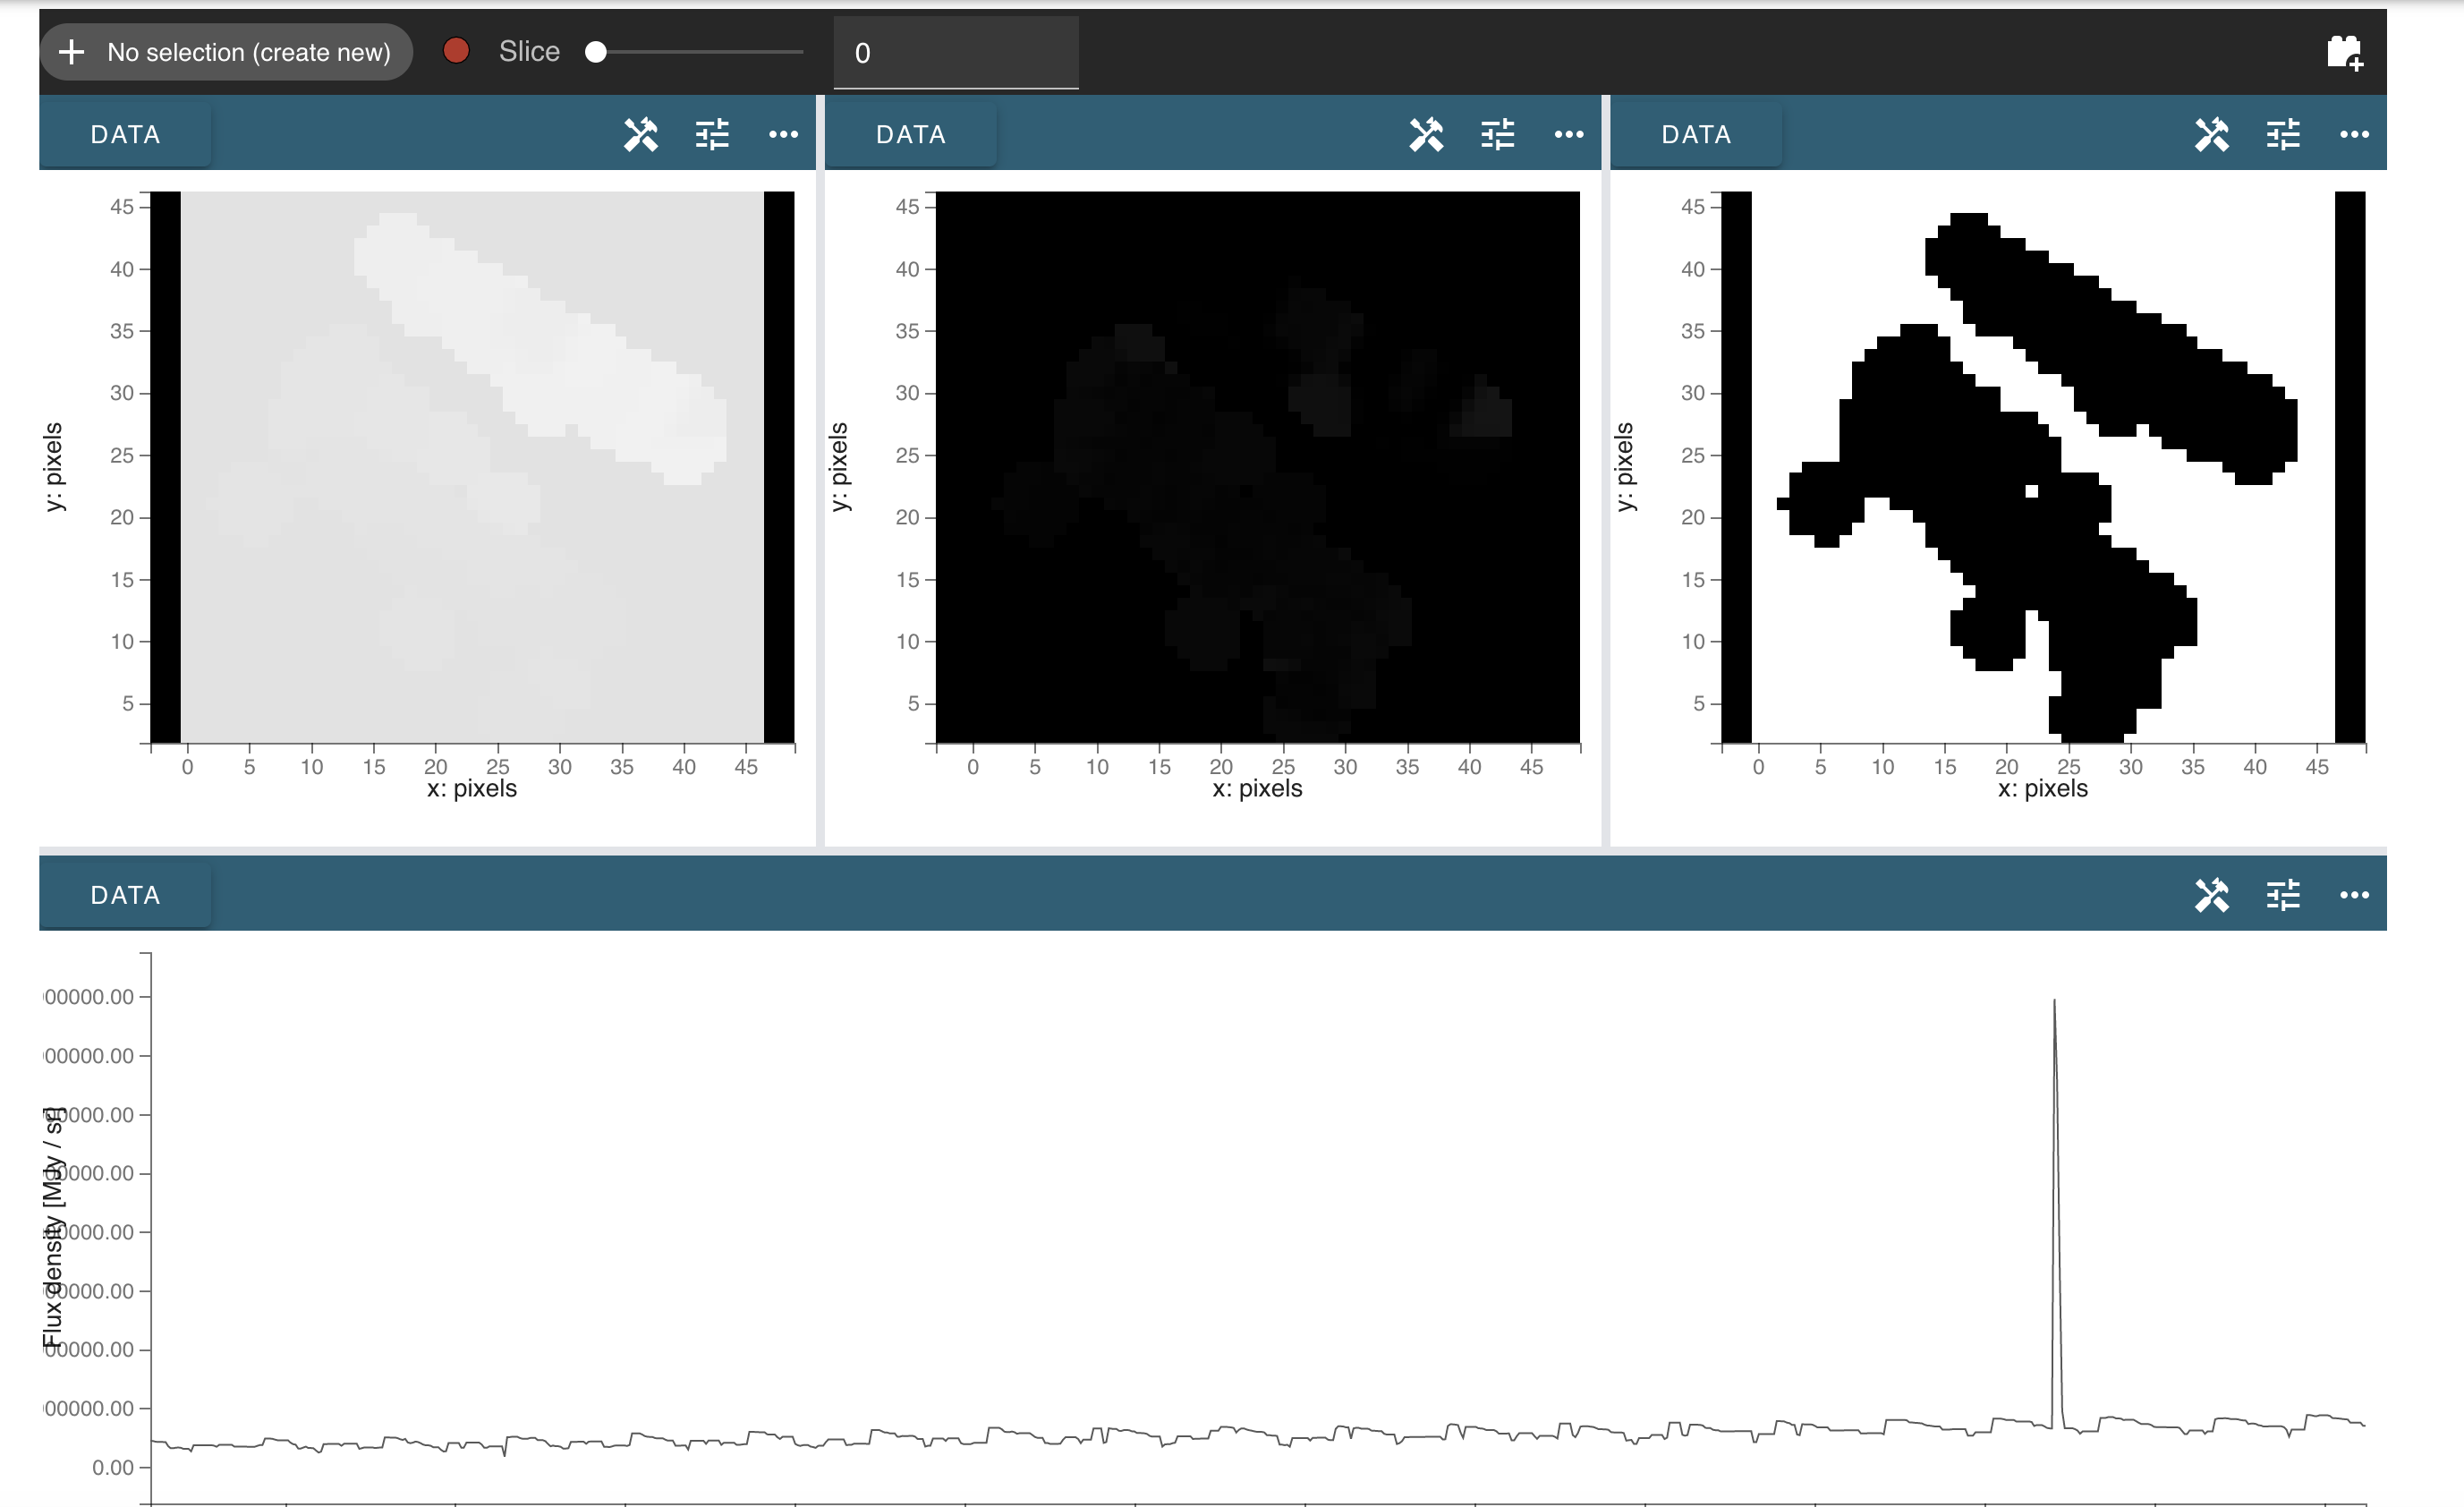
Figure 3 — The Jdaviz Cubeviz configuration, designed to load 3d spectroscopic data such as IFU spectral datacubes. By default, Cubeviz consists of three image viewers, containing the flux (top left), error (top middle), and data quality or mask (top right), and a single 1d spectrum profile viewer (bottom)
Imviz
Imviz is a generalized image viewer for astronomical data (see Figure 4). It accepts the the i2d product type from the Portal. When using Imviz programmatically, you can input a fits file, an NDData object, or a 2D NumPy array.
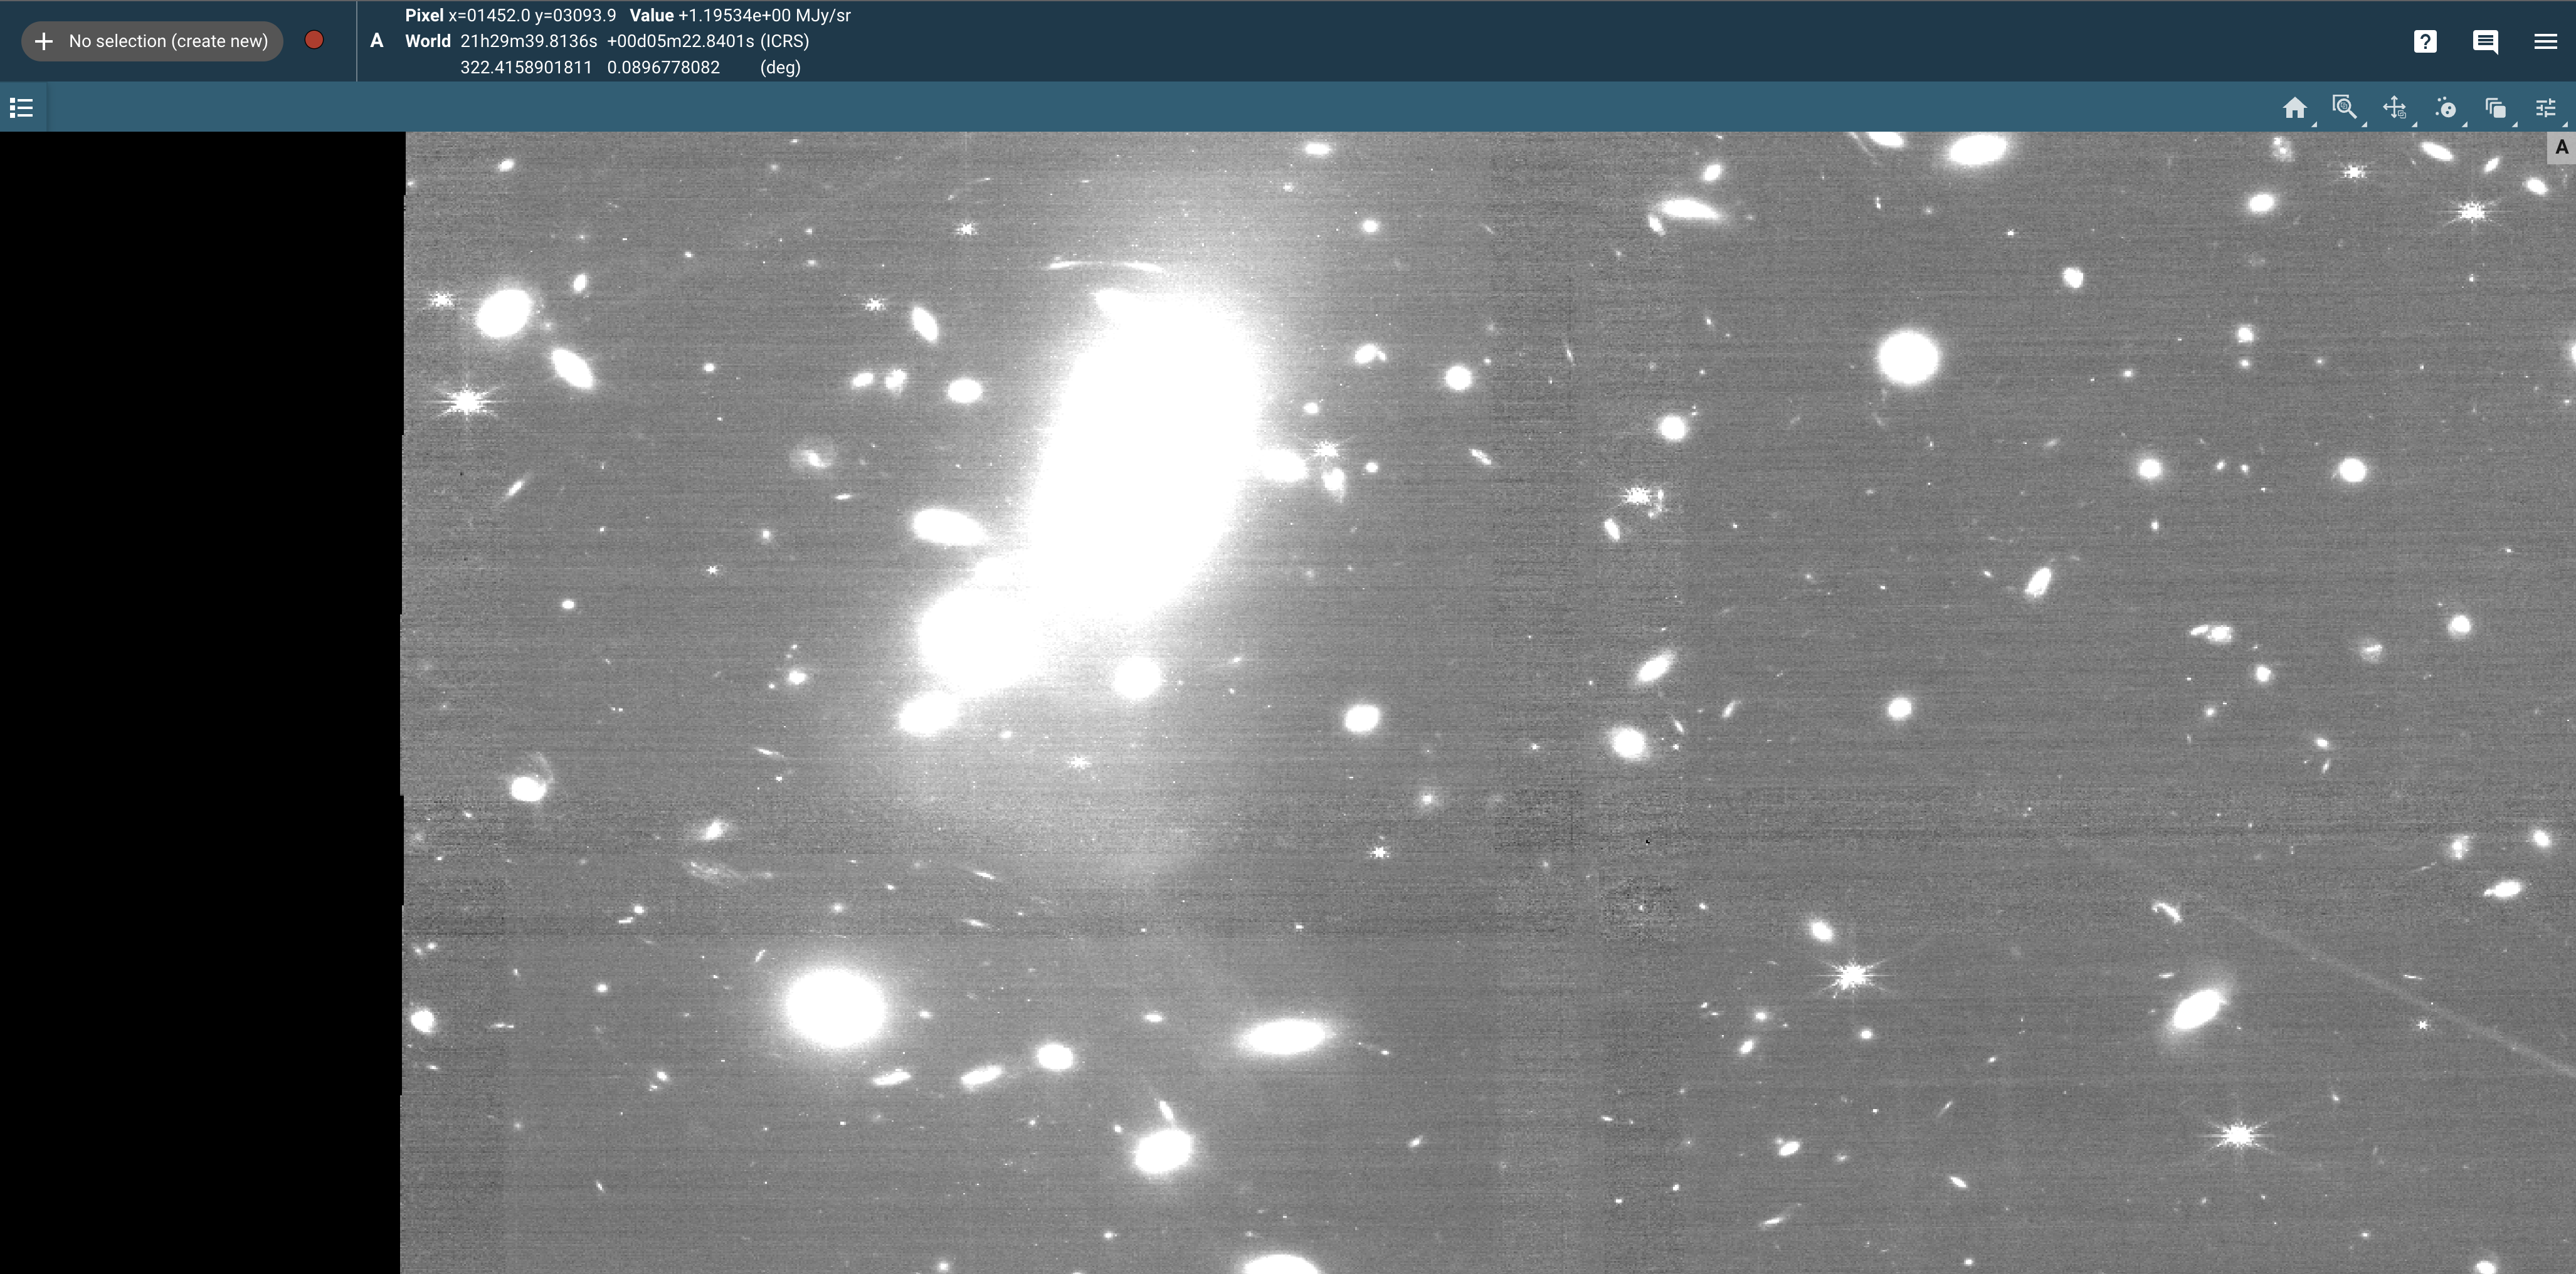
Figure 4 — The Jdaviz Imviz configuration, designed to display images. By default the image takes up the entire viewer and is fully zoomed. It supports the ability to pan and zoom the image, display pixel and world coordinates, and perform simple aperture photometry on sources.
Coming soon to the MAST Portal
Not all Jdaviz features are available in the MAST Portal, as they are still being integrated by our software teams. For full functionality, you can always use Jupyter Notebooks or the standalone application.
Mosviz 
The Mosviz configuration is used for multi-object spectroscopy (MOS; see Figure 5). It is was designed to work with the the JWST NIRCam imager and the NIRSpec microshutter assembly. As such, Mosviz has some features that are specific to NIRSpec and NIRCam data. However, it will work with data from any telescope or instrument. Display Spectra is a good guide on how to manipulate data in the spectral viewers. See Mosviz Analysis Plugins for the cube spectrum analysis plugins.
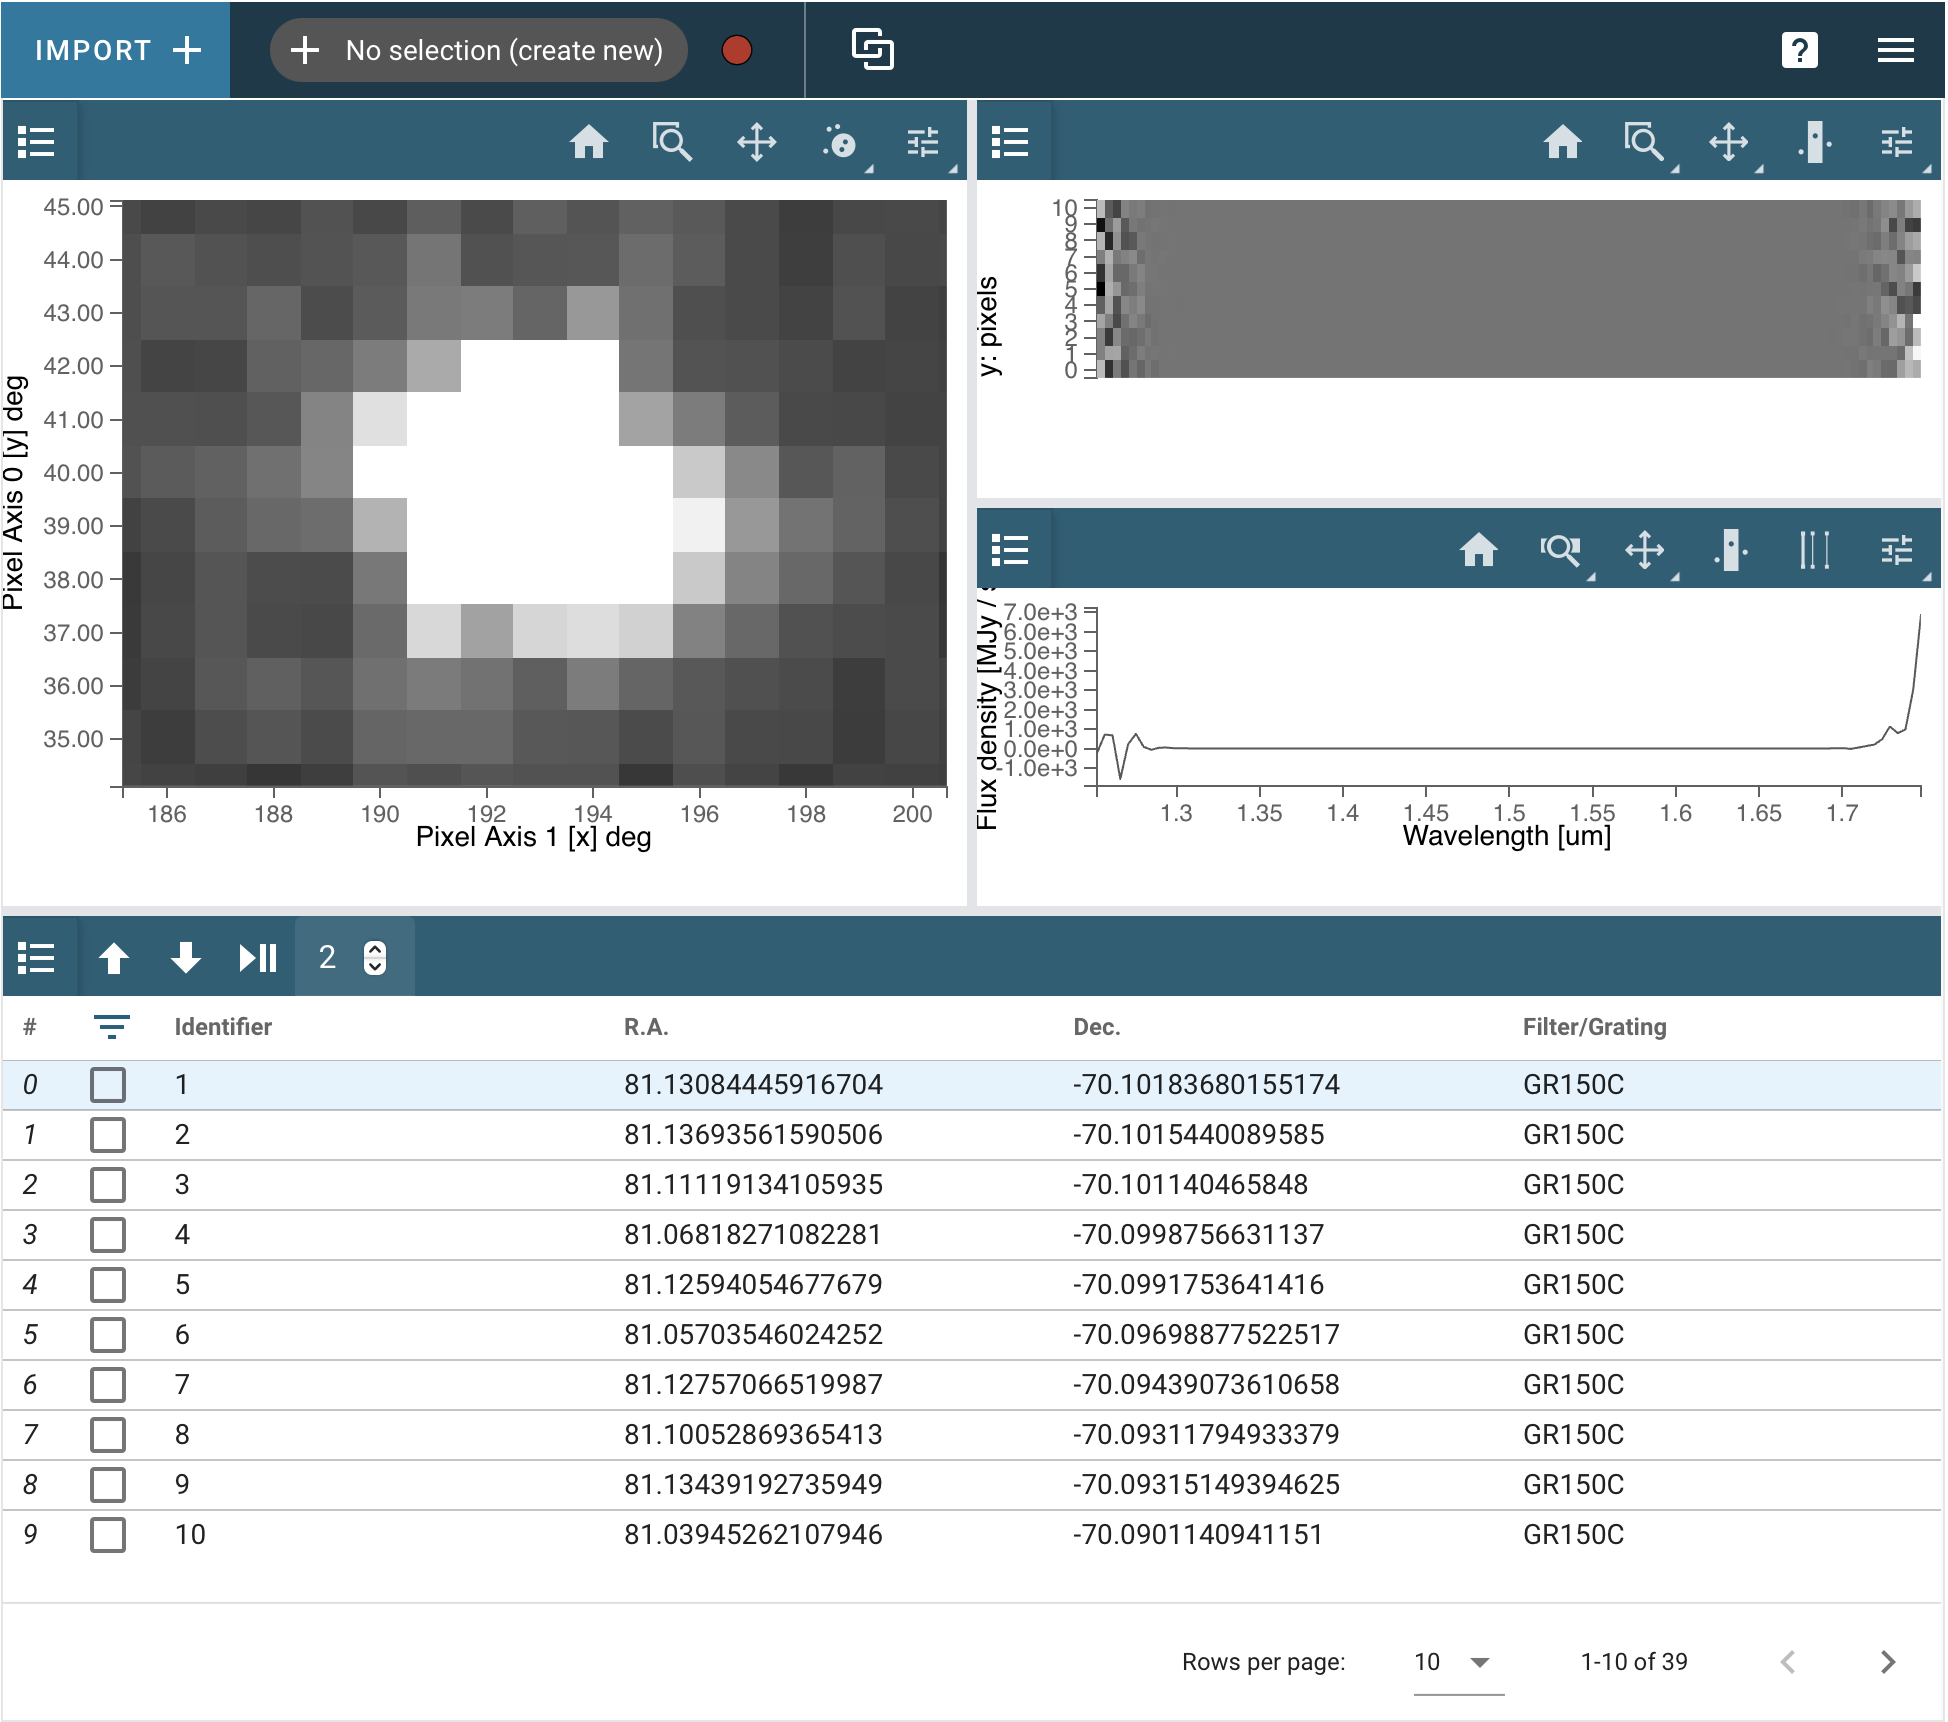
Figure 5 — The Jdaviz Mosviz configuration, designed to display many spectra at once. The default windows are the viewer (top left), a 2D spectrum viewer over a Specviz viewer (top right), and the table viewer (bottom).
For Further Reading...
- Specviz readthedocs, for a more detailed interface overview.
- Jdaviz Documentation